Open Access
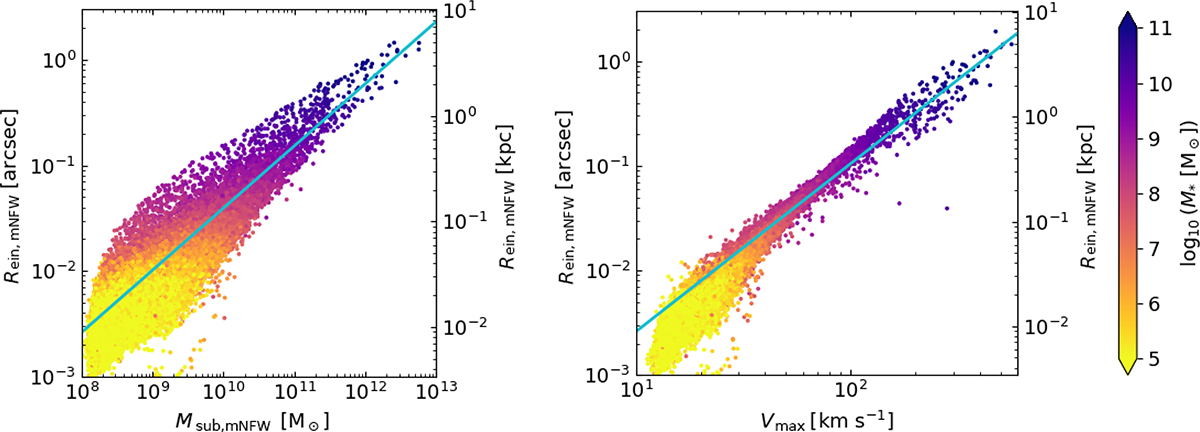
Fig. 12.
Download original image
Scaling of the Einstein radius (obtained from the best mNFW fits) with subhalo mass (left) and Vmax (right). In both plots, the colour-coding of the data points indicates the subhalo stellar mass M*. The cyan lines represent the best power law fit for all of the data points.
Current usage metrics show cumulative count of Article Views (full-text article views including HTML views, PDF and ePub downloads, according to the available data) and Abstracts Views on Vision4Press platform.
Data correspond to usage on the plateform after 2015. The current usage metrics is available 48-96 hours after online publication and is updated daily on week days.
Initial download of the metrics may take a while.