Fig. 11.

Download original image
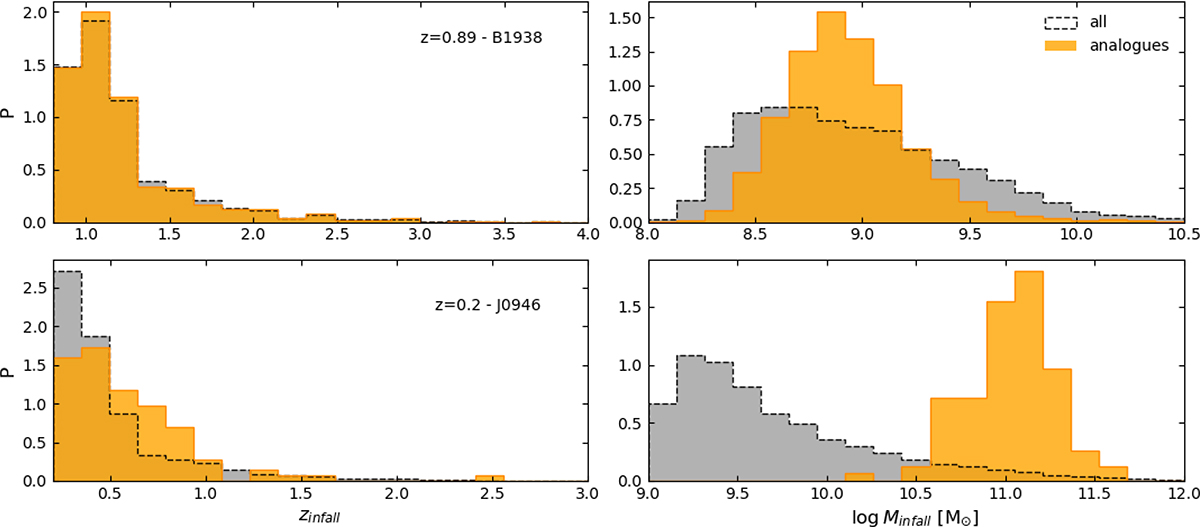
Properties of simulated subhaloes at infall. We used the merger trees to track the subhalo evolution and measure their properties at infall, i.e. at the redshift where they first entered their host halo. We plot the normalised distribution of infall redshifts zinfall (left) and the mass at infall Minfall (right). The orange histograms show the distribution of the subhaloes selected as analogues, i.e. those lying within the orange boxes in the top panels of Fig. 8 for which we show the density profiles in the bottom panels of the same figure. The grey histograms show instead the distribution for all subhaloes in the same host haloes and with final masses between 2×10⁸ M⊙≤Msub(z = 0.89)≤5×10⁹ M⊙ for B1938+666 and 109 M⊙≤Msub(z = 0.2)≤4×10¹¹ M⊙ for J0946+1006.
Current usage metrics show cumulative count of Article Views (full-text article views including HTML views, PDF and ePub downloads, according to the available data) and Abstracts Views on Vision4Press platform.
Data correspond to usage on the plateform after 2015. The current usage metrics is available 48-96 hours after online publication and is updated daily on week days.
Initial download of the metrics may take a while.


