Fig. 10.
Download original image
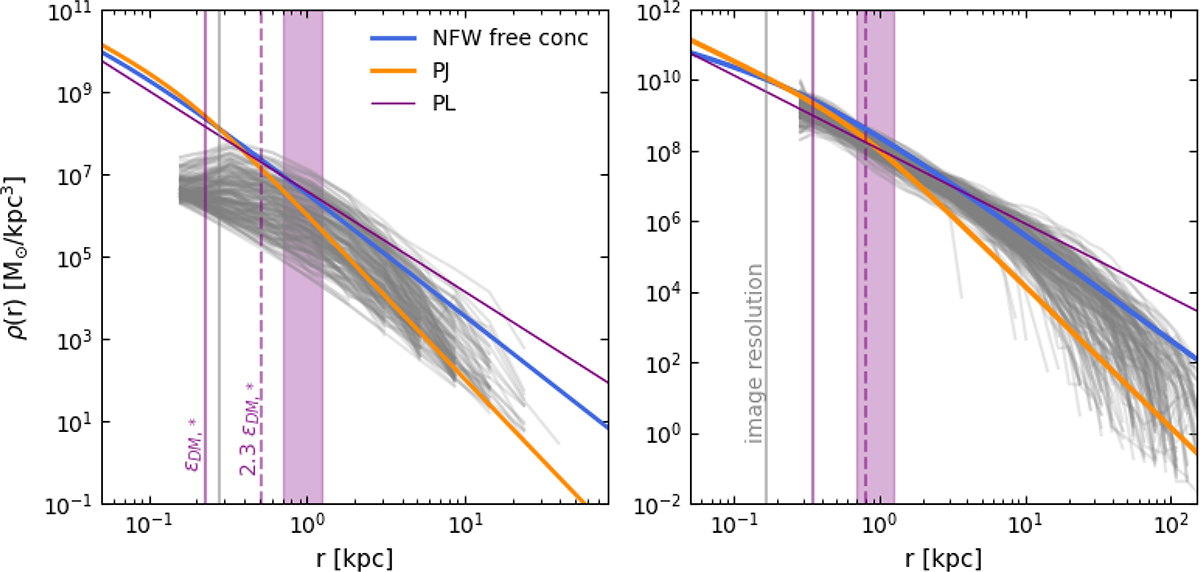
Subhalo density profiles of the simulated subhaloes that best match the observational inference (B1938+666 on the left and J0946+1006 on the right), i.e. the same shown in orange in Fig. 9. The purple band shows the radial range used to measure the slope, γ2D, for Fig. 8. The vertical lines mark the softening of the simulation (vertical solid line), and the value commonly used in simulation as a reliable resolution limit (i.e. 2.3ϵDM,*, vertical dashed line) and the resolution of the observational data.
Current usage metrics show cumulative count of Article Views (full-text article views including HTML views, PDF and ePub downloads, according to the available data) and Abstracts Views on Vision4Press platform.
Data correspond to usage on the plateform after 2015. The current usage metrics is available 48-96 hours after online publication and is updated daily on week days.
Initial download of the metrics may take a while.