Fig. 4
Download original image
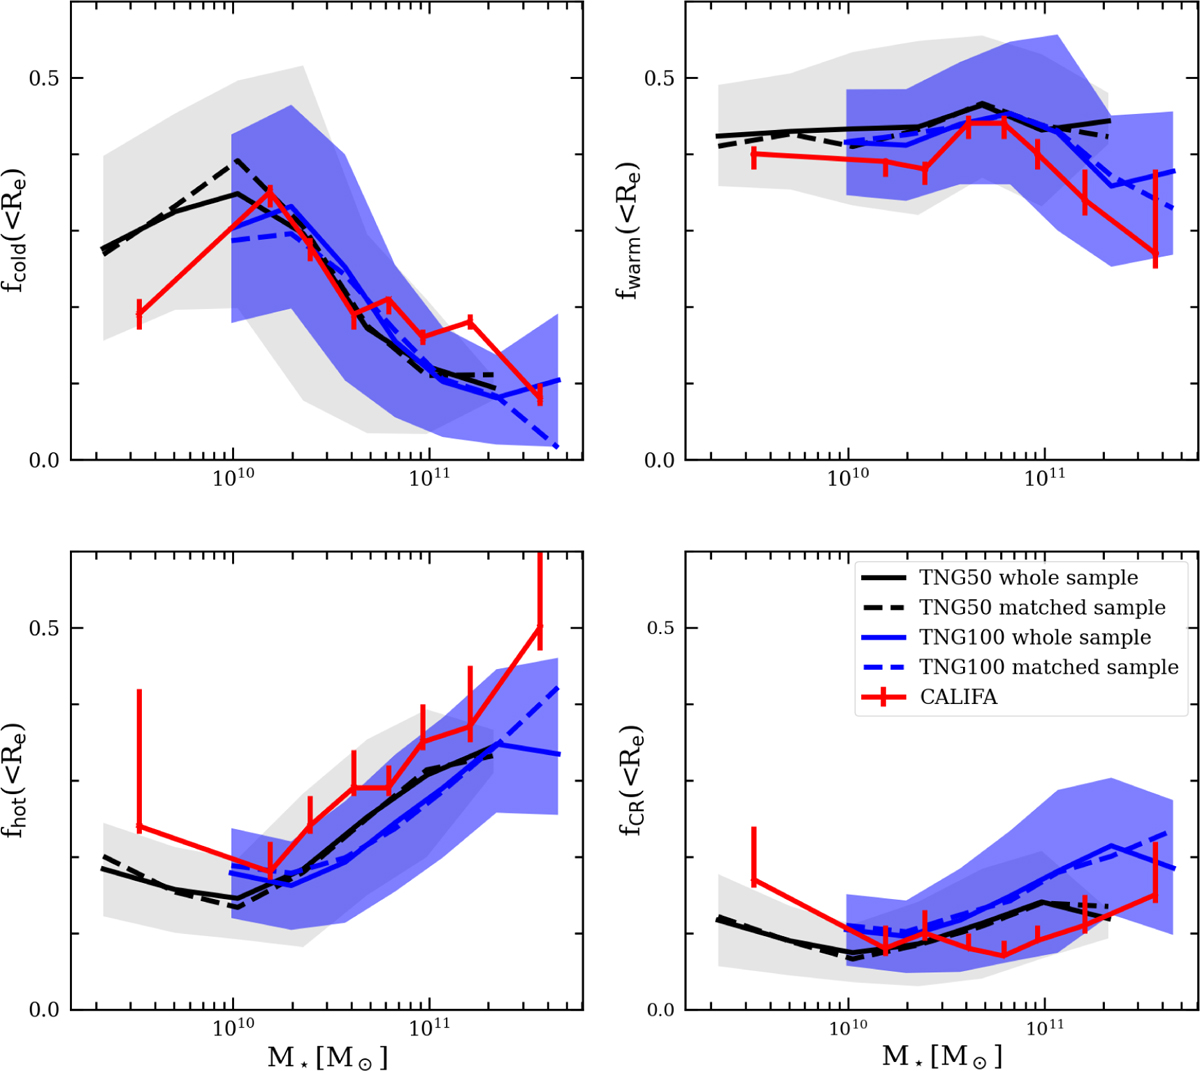
Comparison of luminosity fractions of four orbital components at z ~ 0. All samples shown in Fig. 1 are included. The trend across the four panels each represents the luminosity fraction of the cold, warm, hot, and CR components as functions of stellar mass. Each red solid curves represent the CALIFA galaxies from Zhu et al. (2018c), and the associated error bars represent the 1σ uncertainties. The black and blue curves represent the mean values of luminosity fraction as a function of stellar mass for TNG50 and TNG100 galaxies, respectively. The solid lines are for the whole sample and the dashed lines for the sample matched CALIFA in mass, size, and sSFR. The shaded areas represent the corresponding 1σ scatters, indicating that 68% of the galaxies fall within these regions. Both TNG50 and TNG100 broadly replicate the luminosity fractions of the four components and their dependence on stellar mass, as observed in the CALIFA galaxies.
Current usage metrics show cumulative count of Article Views (full-text article views including HTML views, PDF and ePub downloads, according to the available data) and Abstracts Views on Vision4Press platform.
Data correspond to usage on the plateform after 2015. The current usage metrics is available 48-96 hours after online publication and is updated daily on week days.
Initial download of the metrics may take a while.