Fig. 2
Download original image
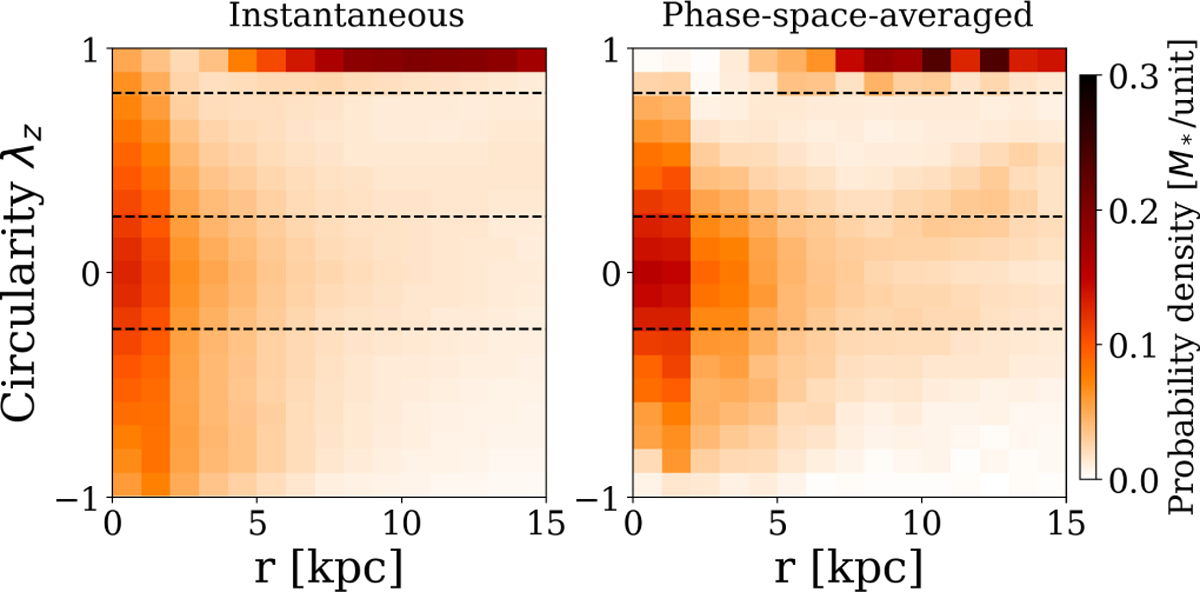
Stellar orbit distribution of TNG50 galaxy. The orbits are represented as the probability density distribution in the phase space of circularity λz vs. radius r. On the left, we use the λz and r calculated from instantaneous positions and velocities of the stellar particles. On the right, we use the orbital λz and r obtained through a phase-space averaging approach, where particles with similar energy and angular momentum are grouped. Dashed lines are used to demarcate the boundaries separating the cold (λz > 0.8), warm (0.25 < λz < 0.8), hot (|λz| < 0.25), and counter-rotating (CR) (λz < −0.25) components based on circularity.
Current usage metrics show cumulative count of Article Views (full-text article views including HTML views, PDF and ePub downloads, according to the available data) and Abstracts Views on Vision4Press platform.
Data correspond to usage on the plateform after 2015. The current usage metrics is available 48-96 hours after online publication and is updated daily on week days.
Initial download of the metrics may take a while.