Fig. 13
Download original image
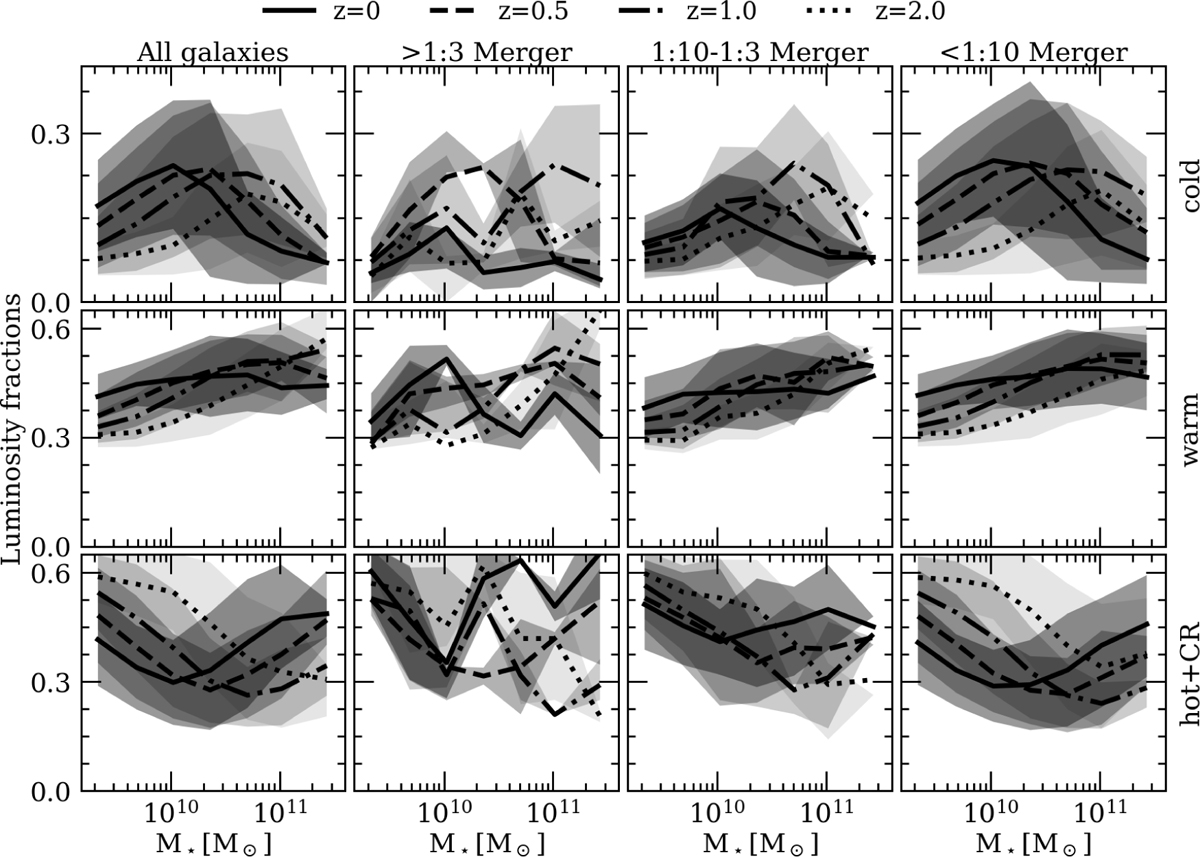
The evolution of galaxy orbital composition with redshift. The columns from left to right are all galaxies, galaxies with major mergers (mass ratio > 1:3), galaxies with minor mergers (mass ratios between 1:10–1:3), and galaxies with negligible mergers or no mergers (mass ratio < 1:10). The rows from top to bottom represent the mass fractions of cold, warm, hot+CR components as functions of the galaxy’s stellar mass within Re. In each panel, the solid, dashed, dash-dotted, and dotted curves represent galaxies at z = 0, and their progenitors at z = 0.5, z = 1, and z = 2, respectively.
Current usage metrics show cumulative count of Article Views (full-text article views including HTML views, PDF and ePub downloads, according to the available data) and Abstracts Views on Vision4Press platform.
Data correspond to usage on the plateform after 2015. The current usage metrics is available 48-96 hours after online publication and is updated daily on week days.
Initial download of the metrics may take a while.