Fig. 11
Download original image
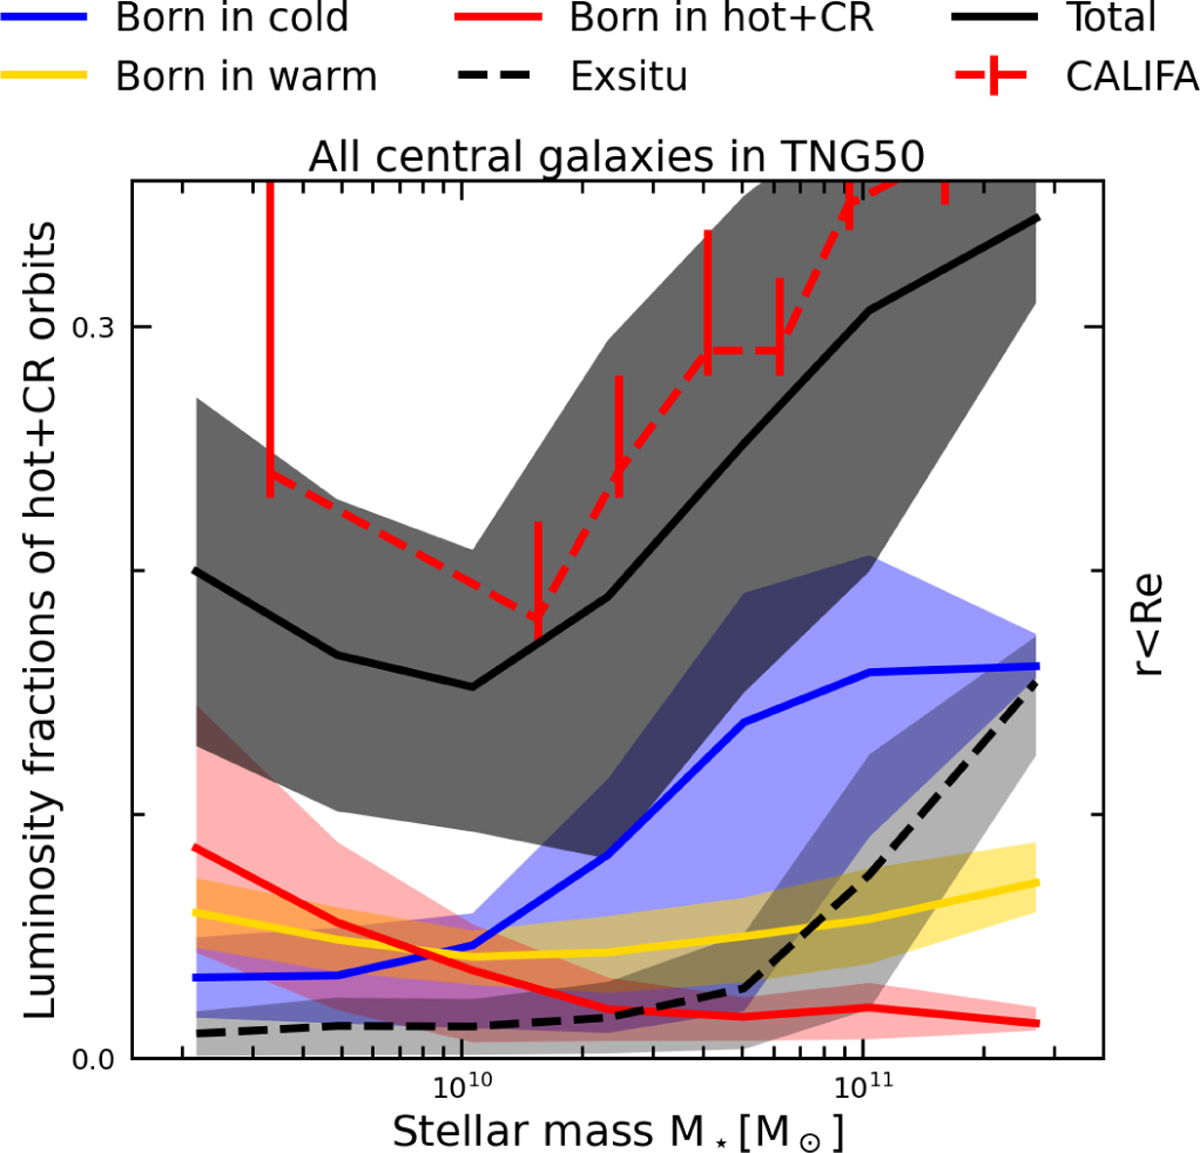
Origin of dynamically hot orbits as a function of stellar mass. All central galaxies in TNG50 are encompassed. The solid black curve depicts the overall luminosity fraction of hot orbits in galaxies at z = 0, consistent with the CALIFA galaxies from observations (red dashed). The blue, yellow, and red curves indicate the contribution from in situ stars born cold, warm, and hot, respectively. The dashed curve represents the contribution of ex situ stars. The shadow areas are the 1σ scatter of galaxies in each mass bin.
Current usage metrics show cumulative count of Article Views (full-text article views including HTML views, PDF and ePub downloads, according to the available data) and Abstracts Views on Vision4Press platform.
Data correspond to usage on the plateform after 2015. The current usage metrics is available 48-96 hours after online publication and is updated daily on week days.
Initial download of the metrics may take a while.