Fig. 1
Download original image
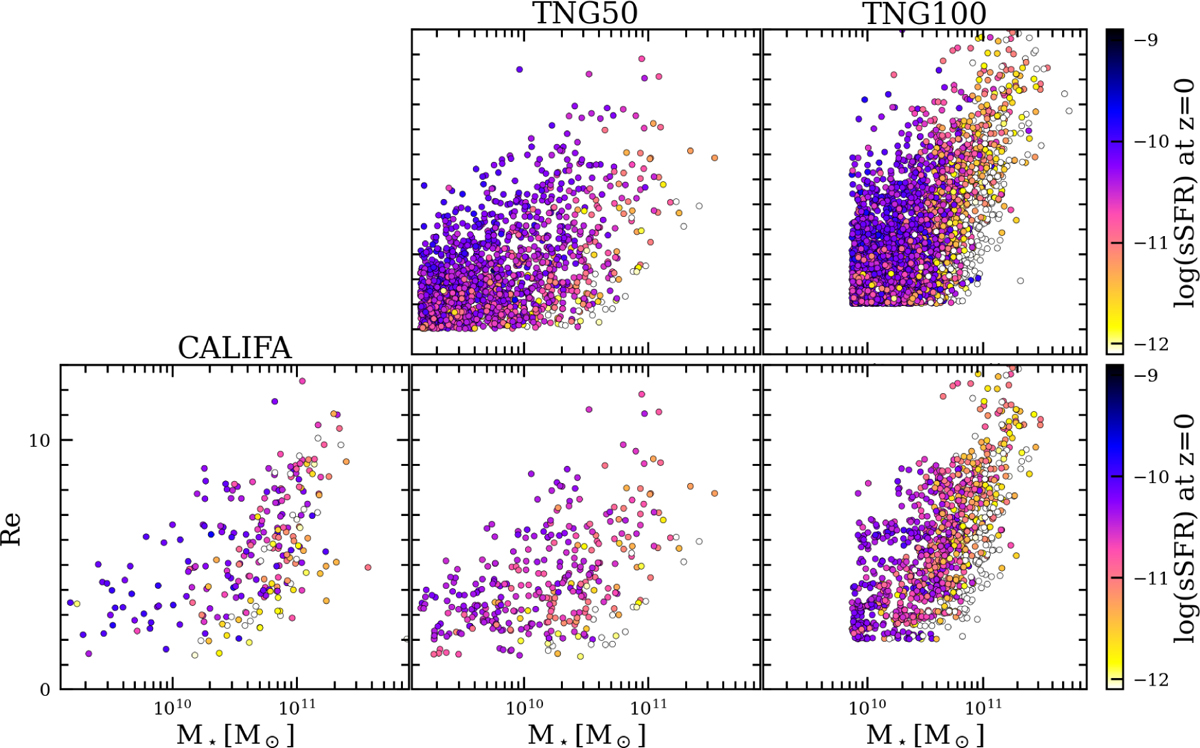
Stellar mass versus Re. CALIFA (left lower), TNG50 (middle) and TNG100 (right) samples are shown for comparison. The galaxies are color-coded by their sSFR, as indicated by the colorbar. The upper panels show the whole sample of central galaxies in the TNG50 and TNG100 selected from the mass-size plane. The bottom panels show samples that matched the CALIFA in mass, size, and sSFR.
Current usage metrics show cumulative count of Article Views (full-text article views including HTML views, PDF and ePub downloads, according to the available data) and Abstracts Views on Vision4Press platform.
Data correspond to usage on the plateform after 2015. The current usage metrics is available 48-96 hours after online publication and is updated daily on week days.
Initial download of the metrics may take a while.