Fig. 9
Download original image
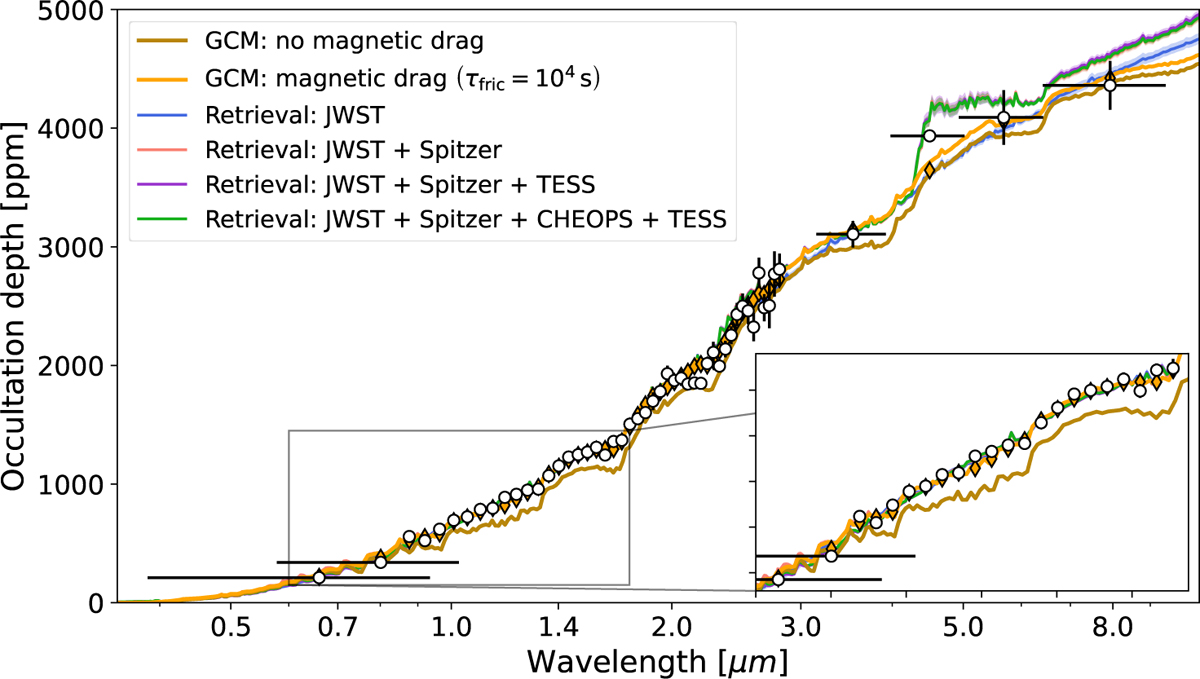
Occultation depths as a function of wavelength. The black points with errorbars represent the measurement from this work (CHEOPS, TESS and Spitzer; 2 leftmost and 4 rightmost points) and from Coulombe et al. (2023) with JWST (0.8-3 μm). The GCM simulations including TiO and VO (Section 6.2) with and without magnetic drag are shown in orange and light brown, respectively. The orange-filled diamonds mark the passband-integrated GCM values with magnetic drag (τfric = 104 s). The retrieval runs (Section 6.3) are shown in blue, pink, purple and green (same colours as in Fig. 10 and Table 6) depending on the data points included in the fit. An inset zoomed-in view of the CHEOPS-to-1.75 μm range is shown in the lower right corner for convenience.
Current usage metrics show cumulative count of Article Views (full-text article views including HTML views, PDF and ePub downloads, according to the available data) and Abstracts Views on Vision4Press platform.
Data correspond to usage on the plateform after 2015. The current usage metrics is available 48-96 hours after online publication and is updated daily on week days.
Initial download of the metrics may take a while.