Fig. 3
Download original image
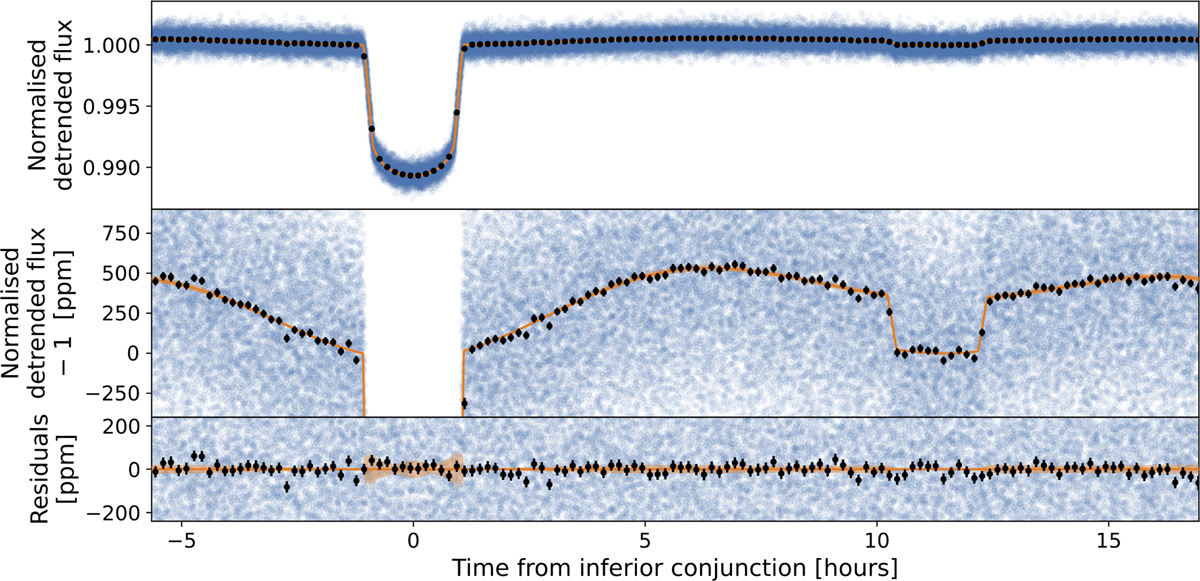
TESS phase-folded phase curve. Data points are shown in blue, and their 10-min binned counterparts are shown in black with error bars. The mean and 3 σ uncertainty of the model are shown in orange (line and shaded area, respectively) and have been computed from a set of 2000 models randomly drawn from the posterior distribution. From top to bottom are show the full phase curve, a zoomed-in version to highlight the phase-curve signal, and the residuals in ppm.
Current usage metrics show cumulative count of Article Views (full-text article views including HTML views, PDF and ePub downloads, according to the available data) and Abstracts Views on Vision4Press platform.
Data correspond to usage on the plateform after 2015. The current usage metrics is available 48-96 hours after online publication and is updated daily on week days.
Initial download of the metrics may take a while.