Fig. H.2
Download original image
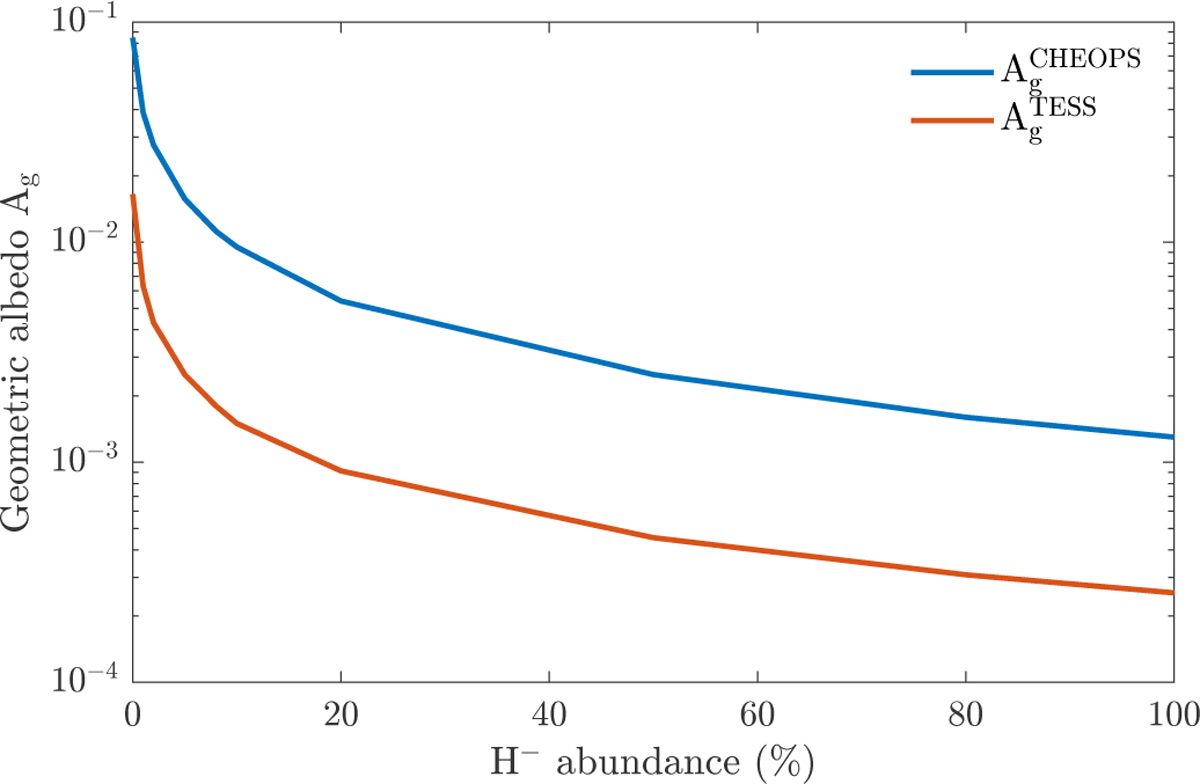
Estimated geometric albedo of WASP-18 b as a function of the abundance of H−. The A g values are computed based on the retrieval results in comparison to the passbands of CHEOPS and TESS. The H− abundance that best matches our measurements reported in Section 6.3 lies around 2% of the expected chemical equilibrium value (100% on the x-axis), i.e. a reduction of 98%.
Current usage metrics show cumulative count of Article Views (full-text article views including HTML views, PDF and ePub downloads, according to the available data) and Abstracts Views on Vision4Press platform.
Data correspond to usage on the plateform after 2015. The current usage metrics is available 48-96 hours after online publication and is updated daily on week days.
Initial download of the metrics may take a while.