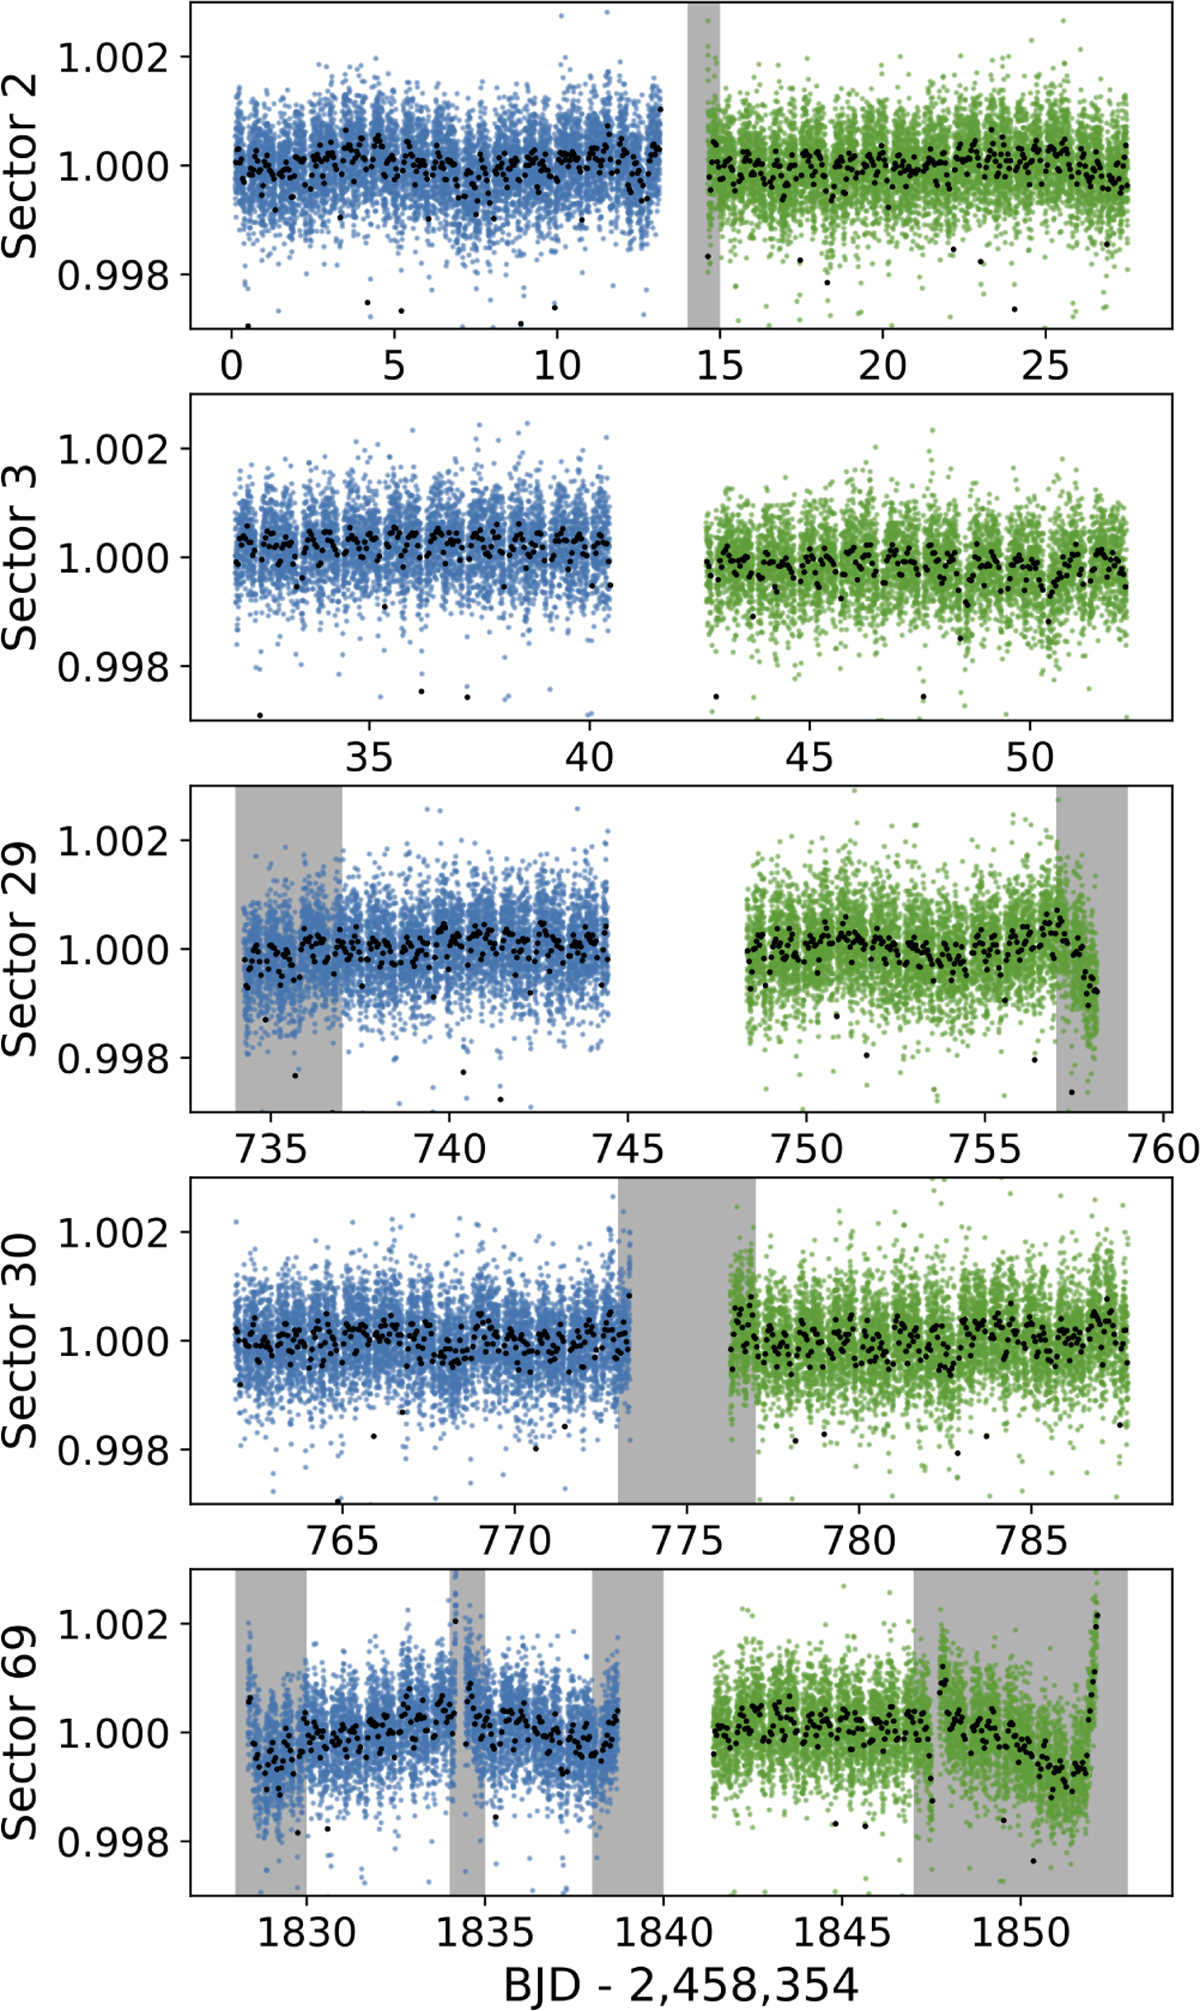
Fig. B.1
Download original image
TESS raw light curves extracted by the SPOC. The coloured points, blue and green, represent the photometric data of the two orbits of each sector. The black points are the data binned at a cadence of 30 min. The shaded areas highlight the photometric ranges that were discarded due to the presence of remaining systematic trends. The times in BJDTDB of the different cuts are listed chronologically in Table B.1. The light curve of sector 3 corresponds to the SAP flux (second panel) and the other sectors (2, 29, 30 and 69) are all PDCSAP fluxes.
Current usage metrics show cumulative count of Article Views (full-text article views including HTML views, PDF and ePub downloads, according to the available data) and Abstracts Views on Vision4Press platform.
Data correspond to usage on the plateform after 2015. The current usage metrics is available 48-96 hours after online publication and is updated daily on week days.
Initial download of the metrics may take a while.