Fig. 11
Download original image
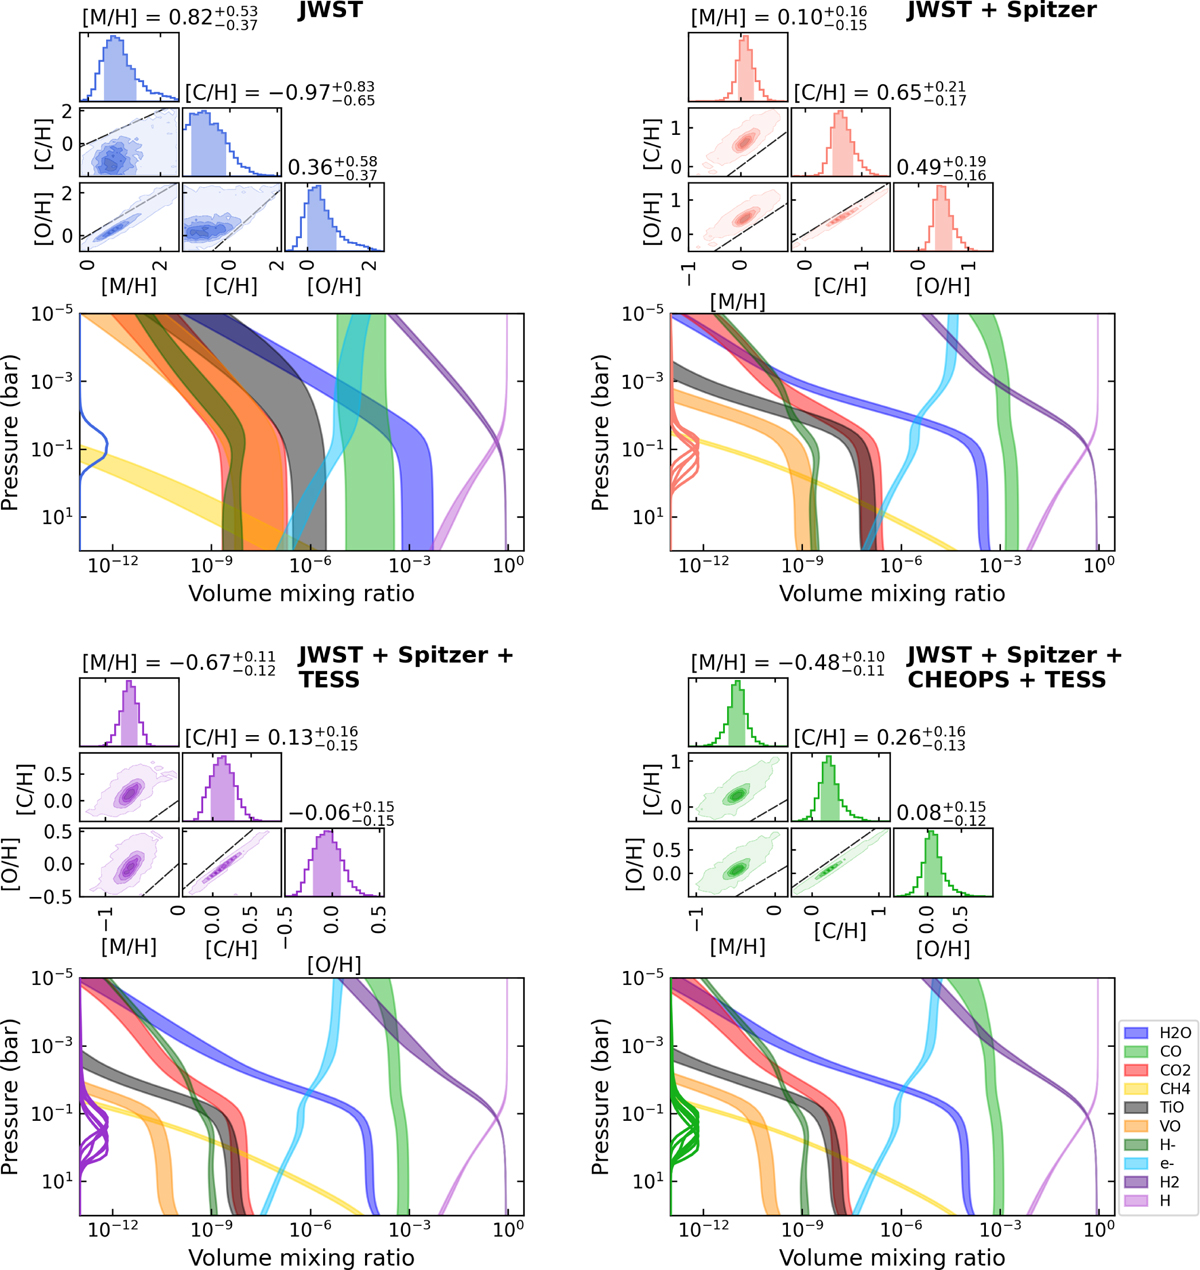
Atmospheric retrieval compositions (each quadrant shows one of the four retrieval runs, labelled in bold text). Top: pairwise and marginal posterior distributions for the abundance free parameters. The quoted values on top of the marginal histograms denote the median and 1σ credible interval for each parameter (span of the central 68% percentiles, also denoted as the shaded areas). The black diagonal dashed lines denote the parameter space values where both parameter are scaled by the same amount (relative to solar abundances). Bottom: volume mixing ratios (VMR) for each retrieval corresponding to the posterior distributions shown above. The shaded areas denote the 1σ credible-interval span in VMR for selected species (see labels at the right of the bottom right quadrant). The solid curves on the left edge of the VMR panels show the contribution functions that indicate the pressures probed by the observations.
Current usage metrics show cumulative count of Article Views (full-text article views including HTML views, PDF and ePub downloads, according to the available data) and Abstracts Views on Vision4Press platform.
Data correspond to usage on the plateform after 2015. The current usage metrics is available 48-96 hours after online publication and is updated daily on week days.
Initial download of the metrics may take a while.