Fig. 10
Download original image
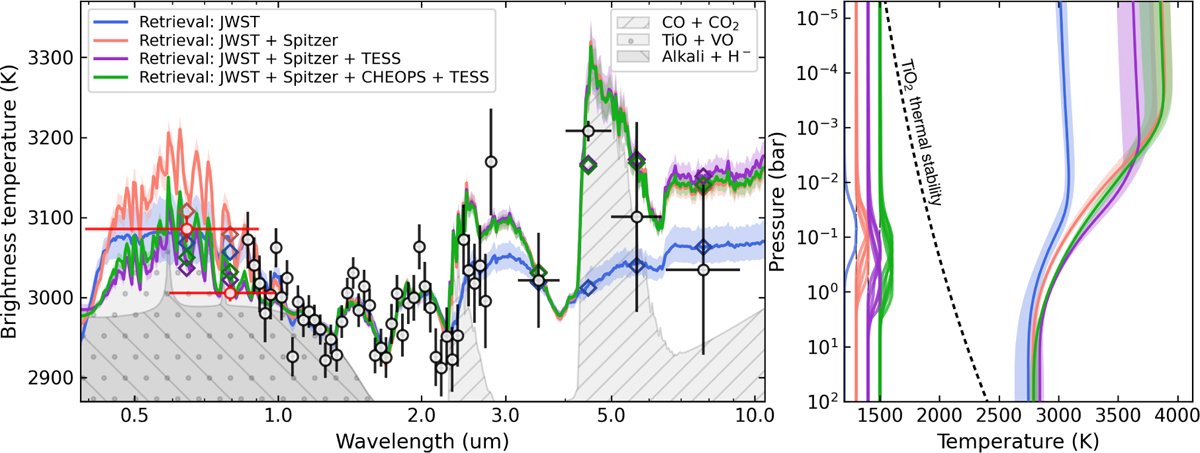
Brightness-temperature spectra derived from the atmospheric retrieval analyses. The circle markers with error bars show the observed occultation depths with uncertainties. The two leftmost circles (red) correspond to CHEOPS and TESS passbands, while the four rightmost black points cover the Spitzer/IRAC channels. The JWST spectroscopic observations are shown in black between 0.8 and 3.0 μm and have been binned down for better visualisation. The coloured solid curves with shaded areas denote the retrieved median spectra and span of the 1σ credible interval for the four model fits (see legend). The diamond markers show the model spectra integrated over the photometric bands. The grey shaded areas highlight the contributions of some relevant species to thermal emission: alkali/H− and TiO/VO in the blue end, and CO/CO2 in the infrared. Right panel: the median (solid curves) and 1σ credible interval (shaded area) of the temperature-profile posterior distributions (same colour coding as in the left panel). The curves on the left edge show the normalized contribution functions that indicate the pressures mainly probed by the observations according to each retrieval analysis. The dashed black line shows the thermal stability curve for TiO2. Other thermal stability curves for species of interest, such as alkali metals (Na2S or KCl), are situated at even lower temperatures around ~1000 K.
Current usage metrics show cumulative count of Article Views (full-text article views including HTML views, PDF and ePub downloads, according to the available data) and Abstracts Views on Vision4Press platform.
Data correspond to usage on the plateform after 2015. The current usage metrics is available 48-96 hours after online publication and is updated daily on week days.
Initial download of the metrics may take a while.