Fig. 1
Download original image
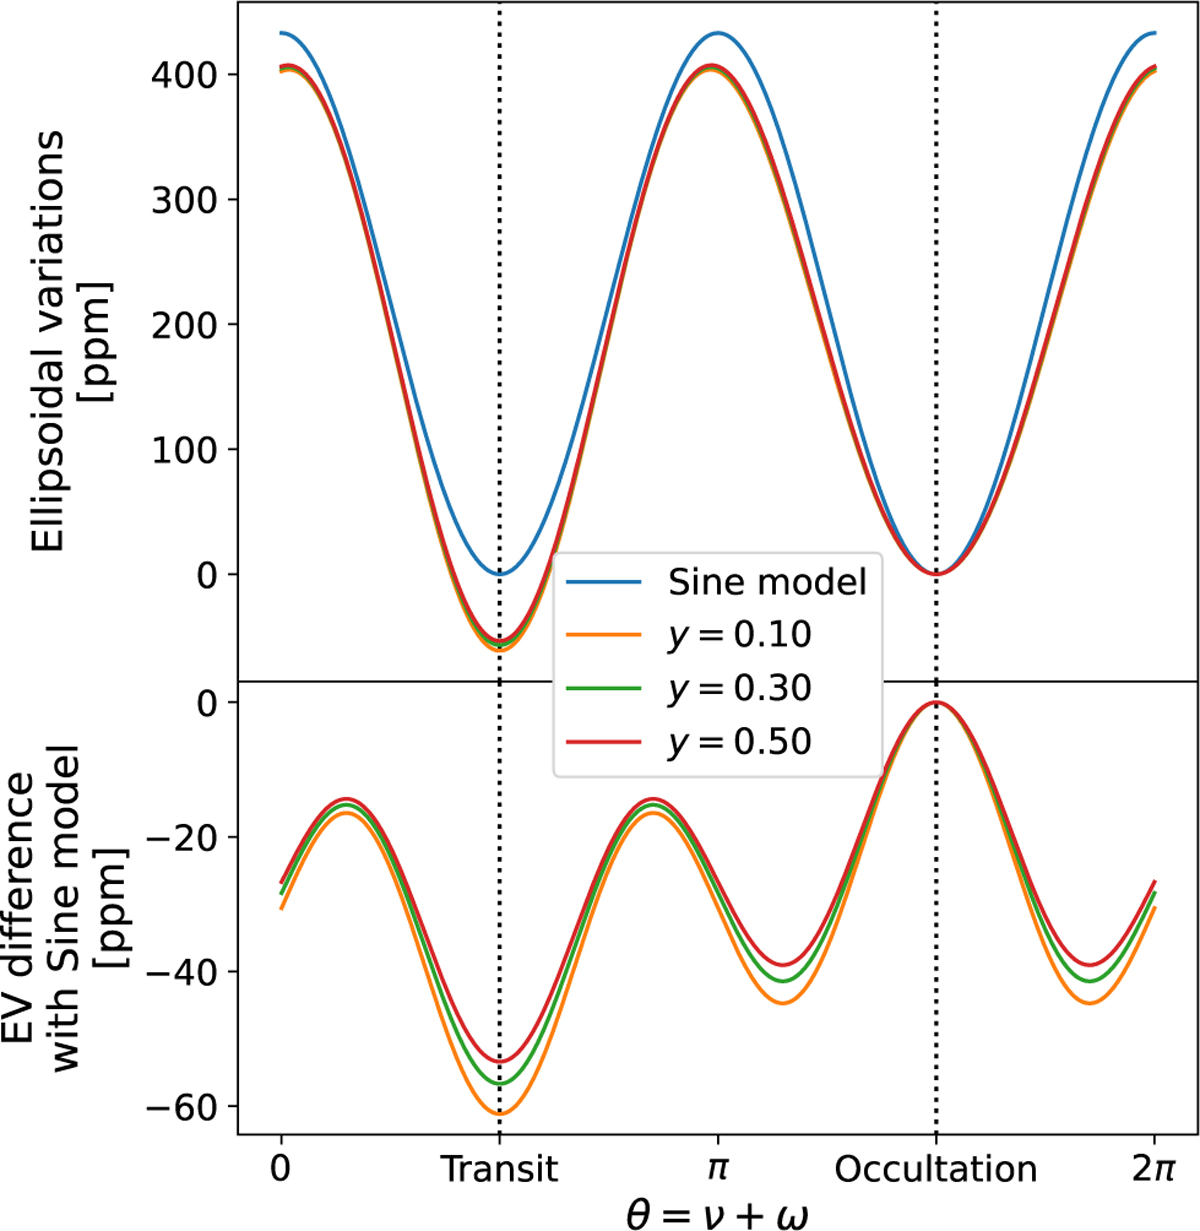
Top: ellipsoidal variations modelled with and without secondary terms for the best-fit parameters in the CHEOPS passband. The x-axis represents the orbital phase of the planet θ = ν + ω, where ν and ω are the true anomaly and the argument of periastron, respectively. The blue curve (Sine model) is computed as a simple sine wave, i.e. with A 1 = A 3 = 0. The other models include the secondary terms that are computed for several values of the gravity-darkening coefficient y. Bottom: differences between the different EV models and the Sine model. The peak-to-peak difference in amplitude is of the order of 50 ppm for the realistic range of GDC values (0.1 ≤ y ≤ 0.5). The effect of accounting for A 1 and A 3 in the modelling of EV impacts mainly the difference in baseline level between transit and occultation. The baseline flux during transit will be lower than that during occultation (effect similar to a negative nightside flux). If not taken into account, this may lead to overestimating the occultation depth or underestimating the nightside flux from a planet.
Current usage metrics show cumulative count of Article Views (full-text article views including HTML views, PDF and ePub downloads, according to the available data) and Abstracts Views on Vision4Press platform.
Data correspond to usage on the plateform after 2015. The current usage metrics is available 48-96 hours after online publication and is updated daily on week days.
Initial download of the metrics may take a while.