Fig. 9
Download original image
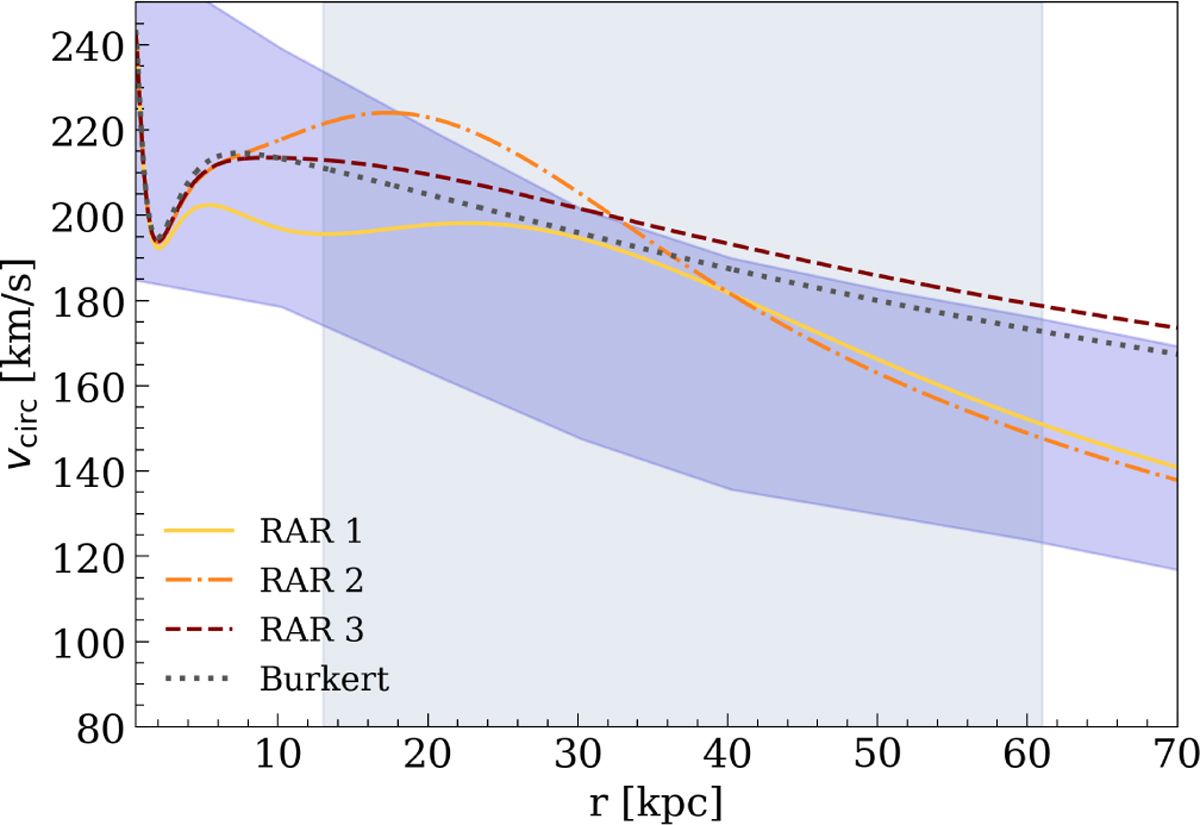
Circular velocity profiles for each DM model studied in this work. The shaded gray region represents the zone where the progenitor moves along its way around the MW. The shaded blue region denotes the reproduced 95% confidence region of the best-fit circular velocity curve of Gibbons et al. (2014). Note that the four circular velocity curves agree relatively well with the best-fit prediction, despite slight differences at upper marginal values. At the same time, for r ≳ 40 kpc the polytropic profiles (RAR 1 and RAR 2) fall sharper than the power-law-like profiles (RAR 3 and Burkert), as was expected based on Fig. 3.
Current usage metrics show cumulative count of Article Views (full-text article views including HTML views, PDF and ePub downloads, according to the available data) and Abstracts Views on Vision4Press platform.
Data correspond to usage on the plateform after 2015. The current usage metrics is available 48-96 hours after online publication and is updated daily on week days.
Initial download of the metrics may take a while.