Fig. 8
Download original image
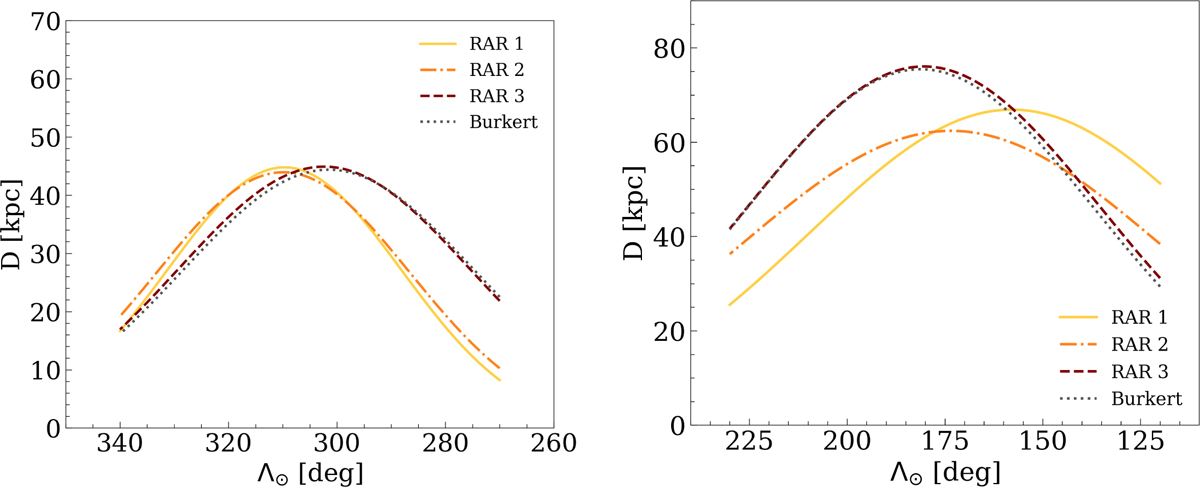
Analytic functions tracing the Galactocentric distance of both main tails of the Sgr stellar stream, the leading one (left plot) and the trailing one (right plot). Every curve is a Gaussian function, whose maximum represents the value of its corresponding apocentric distance. The location of the maximum is the longitude, Λ⊙, of the corresponding apocenter, used to compute the heliocentric angular aperture. There is one curve for each DM model considered in the work.
Current usage metrics show cumulative count of Article Views (full-text article views including HTML views, PDF and ePub downloads, according to the available data) and Abstracts Views on Vision4Press platform.
Data correspond to usage on the plateform after 2015. The current usage metrics is available 48-96 hours after online publication and is updated daily on week days.
Initial download of the metrics may take a while.