Open Access
Fig. 6
Download original image
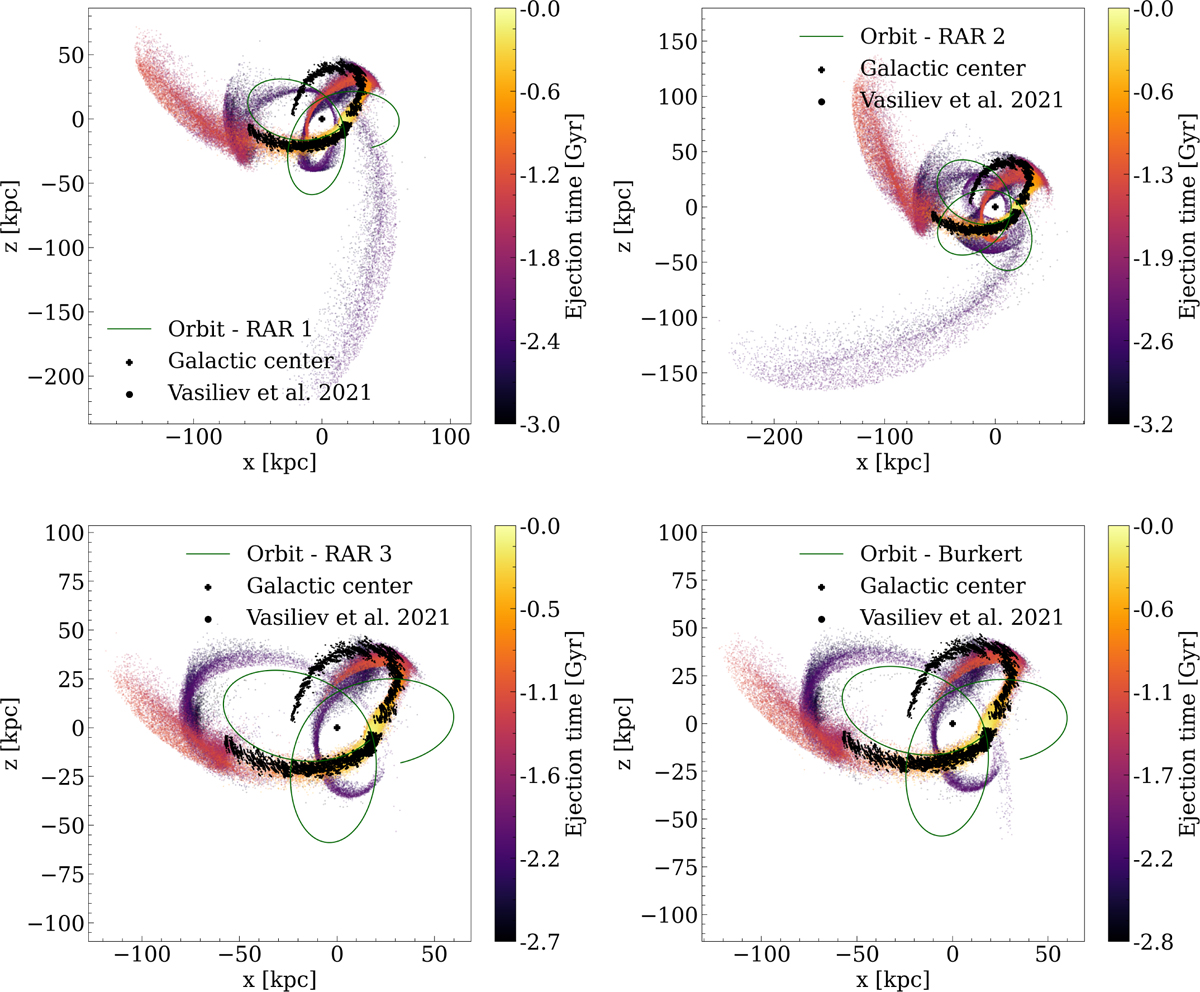
Streams of stars projected in the x − z plane at present, color-coded by the ejection time. The black dots represent the x–z coordinates of the Vasiliev et al. (2021) stars. The solid green lines indicate the orbit of the satellite in its corresponding gravitational potential.
Current usage metrics show cumulative count of Article Views (full-text article views including HTML views, PDF and ePub downloads, according to the available data) and Abstracts Views on Vision4Press platform.
Data correspond to usage on the plateform after 2015. The current usage metrics is available 48-96 hours after online publication and is updated daily on week days.
Initial download of the metrics may take a while.