Fig. 12
Download original image
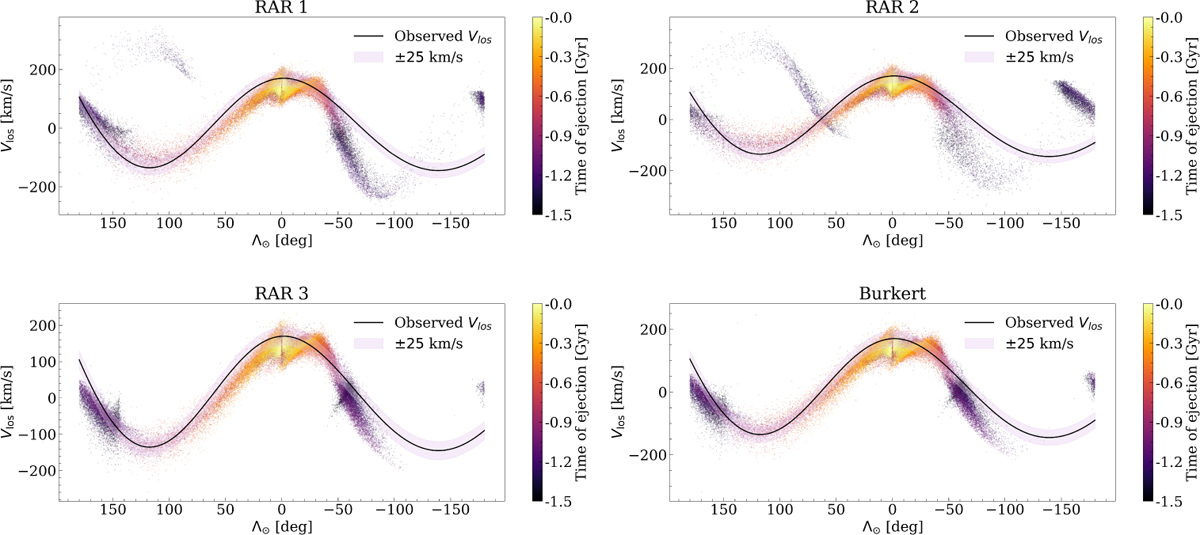
Line-of-sight velocity component of the stars of the four predicted streams at present, color-coded with their ejection time. The solid black line represents the fit line-of-sight velocity as a function of Λ⊙ computed by I+2020, based on the Law & Majewski (2010) model. The shaded pink region represents the limits to account for Galactic field star contaminants, though here it was used a more stringent value than in I+2020 to reduce the contamination fraction.
Current usage metrics show cumulative count of Article Views (full-text article views including HTML views, PDF and ePub downloads, according to the available data) and Abstracts Views on Vision4Press platform.
Data correspond to usage on the plateform after 2015. The current usage metrics is available 48-96 hours after online publication and is updated daily on week days.
Initial download of the metrics may take a while.