Open Access
Fig. 10
Download original image
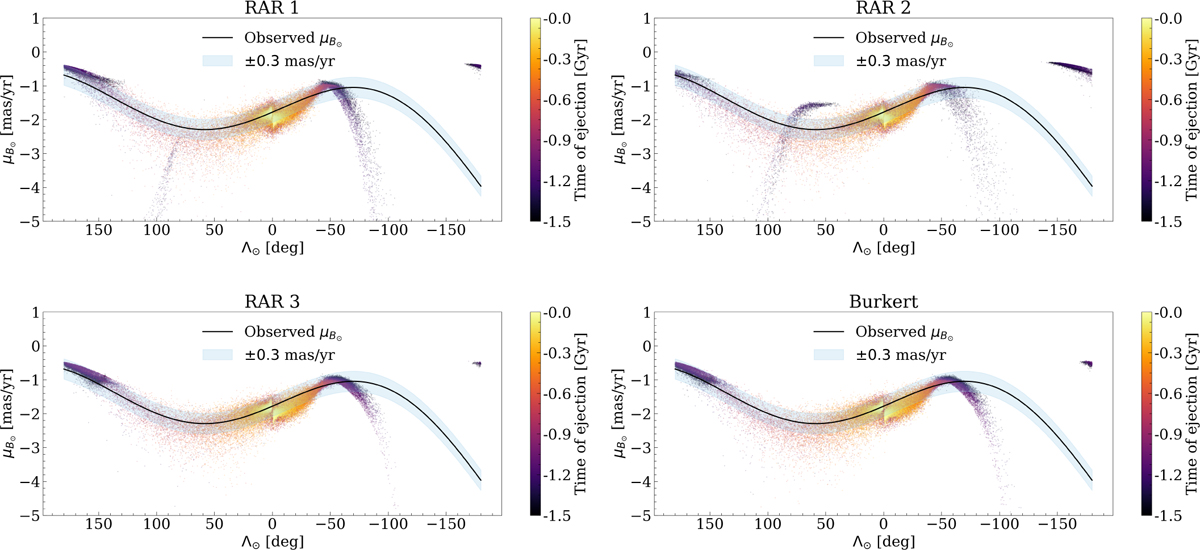
Mock stream star ![]() components at present, color-coded by the ejection time. The solid black line represents the sigma-clipping fit line computed by I+2020. The shaded light blue region is the confidence interval shown in Fig. 1.
components at present, color-coded by the ejection time. The solid black line represents the sigma-clipping fit line computed by I+2020. The shaded light blue region is the confidence interval shown in Fig. 1.
Current usage metrics show cumulative count of Article Views (full-text article views including HTML views, PDF and ePub downloads, according to the available data) and Abstracts Views on Vision4Press platform.
Data correspond to usage on the plateform after 2015. The current usage metrics is available 48-96 hours after online publication and is updated daily on week days.
Initial download of the metrics may take a while.