Fig. 1
Download original image
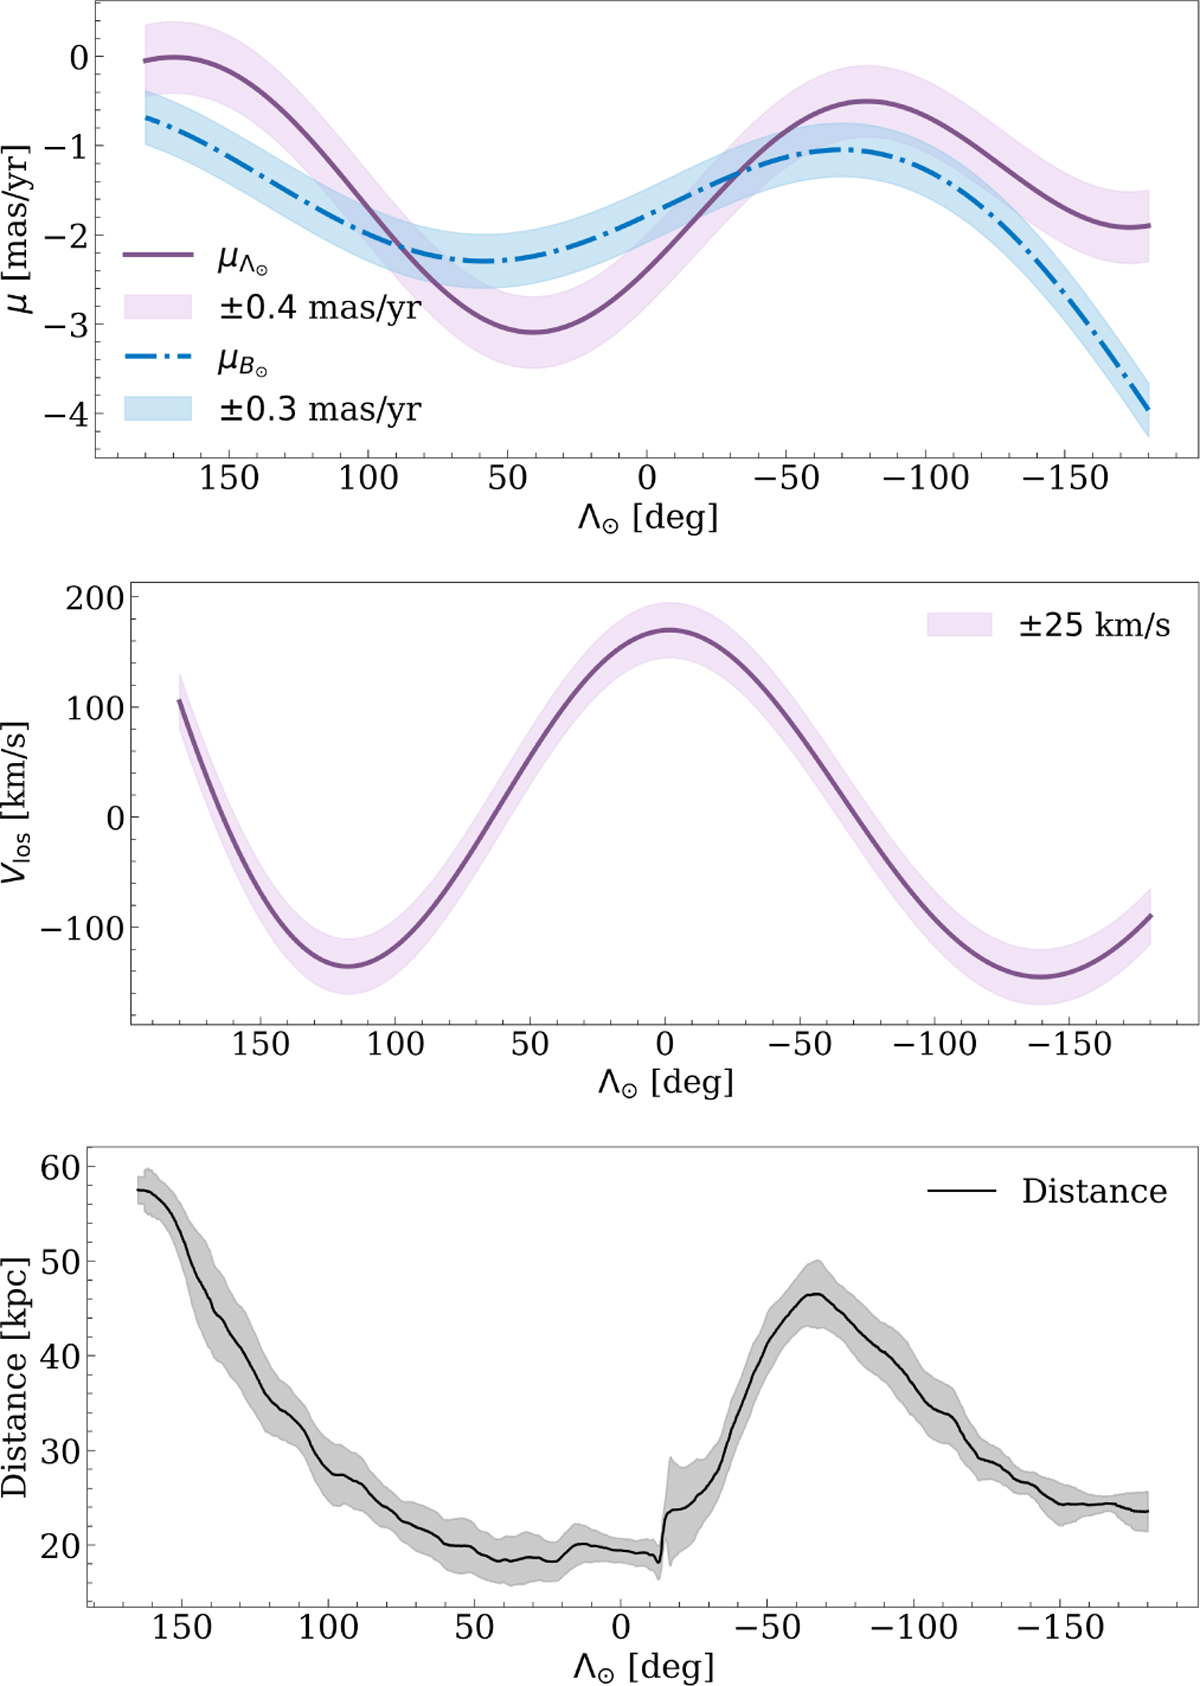
Best-fit proper motions (upper panel) and line-of-sight velocity (middle panel) functions described by the expressions given in Eqs. (1) and (2), respectively. Their coefficients are shown in Table 1. The shaded regions in the proper motion plot show the confidence intervals (see Figs. 2b and 2c of Ibata et al. (2020) to contrast the polynomials with the stars’ distribution) such that the stream stars selected by I+2020 have a contamination of 11%. The shaded region in the radial velocity plot corresponds to half the interval that selects stars with a global contamination of 18% according to I+2020. Bottom panel: moving average Galactocentric distance as a function of the longitude, Λ⊙, for the set of stars given in Vasiliev et al. (2021), with the shaded gray region representing the corresponding moving average error along the stream.
Current usage metrics show cumulative count of Article Views (full-text article views including HTML views, PDF and ePub downloads, according to the available data) and Abstracts Views on Vision4Press platform.
Data correspond to usage on the plateform after 2015. The current usage metrics is available 48-96 hours after online publication and is updated daily on week days.
Initial download of the metrics may take a while.