Fig. 6.
Download original image
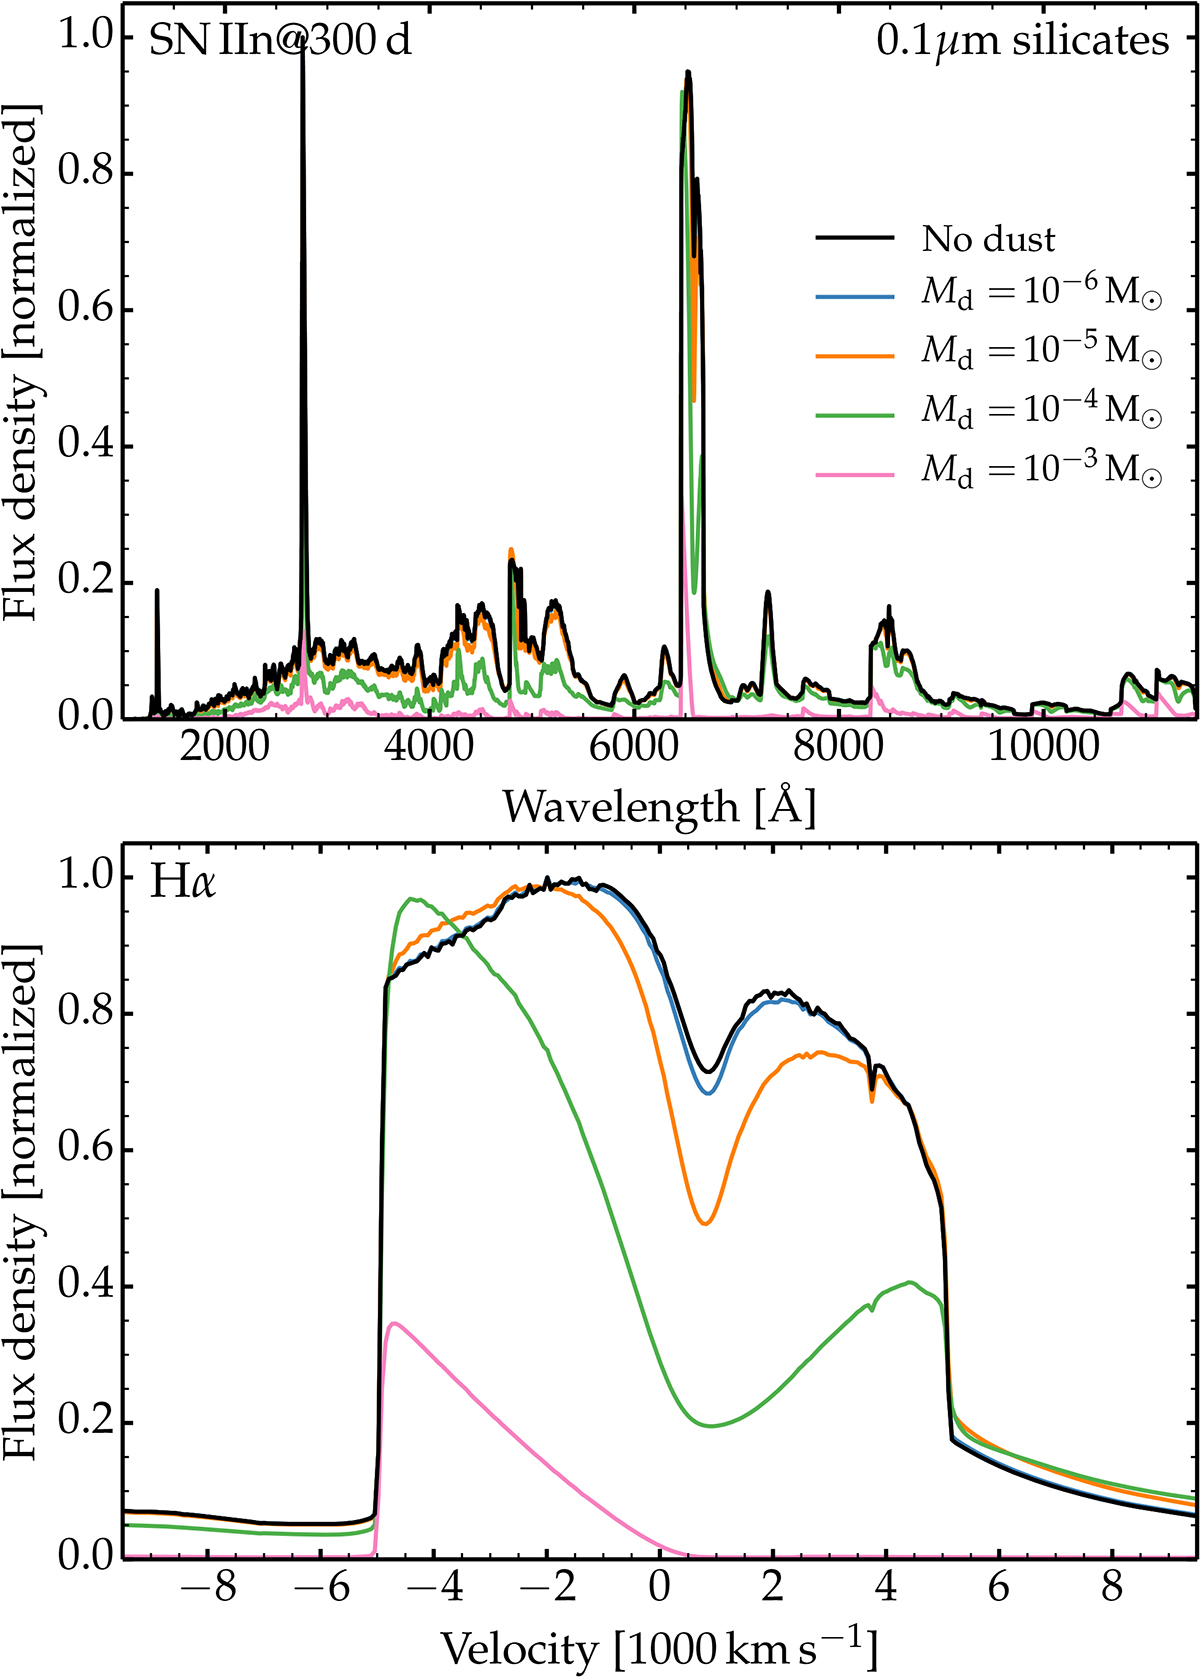
Impact of the dust mass on the spectral properties of the SN IIn model at 300 d. When included, the dust was placed within the dense shell at 5000 km s−1 (purple curve in the top panel of Fig. 5). The figure is analogous to Fig. 5 and shows the impact on the ultraviolet and optical spectrum (top) and on the Hα profile (bottom).
Current usage metrics show cumulative count of Article Views (full-text article views including HTML views, PDF and ePub downloads, according to the available data) and Abstracts Views on Vision4Press platform.
Data correspond to usage on the plateform after 2015. The current usage metrics is available 48-96 hours after online publication and is updated daily on week days.
Initial download of the metrics may take a while.