Fig. 5.
Download original image
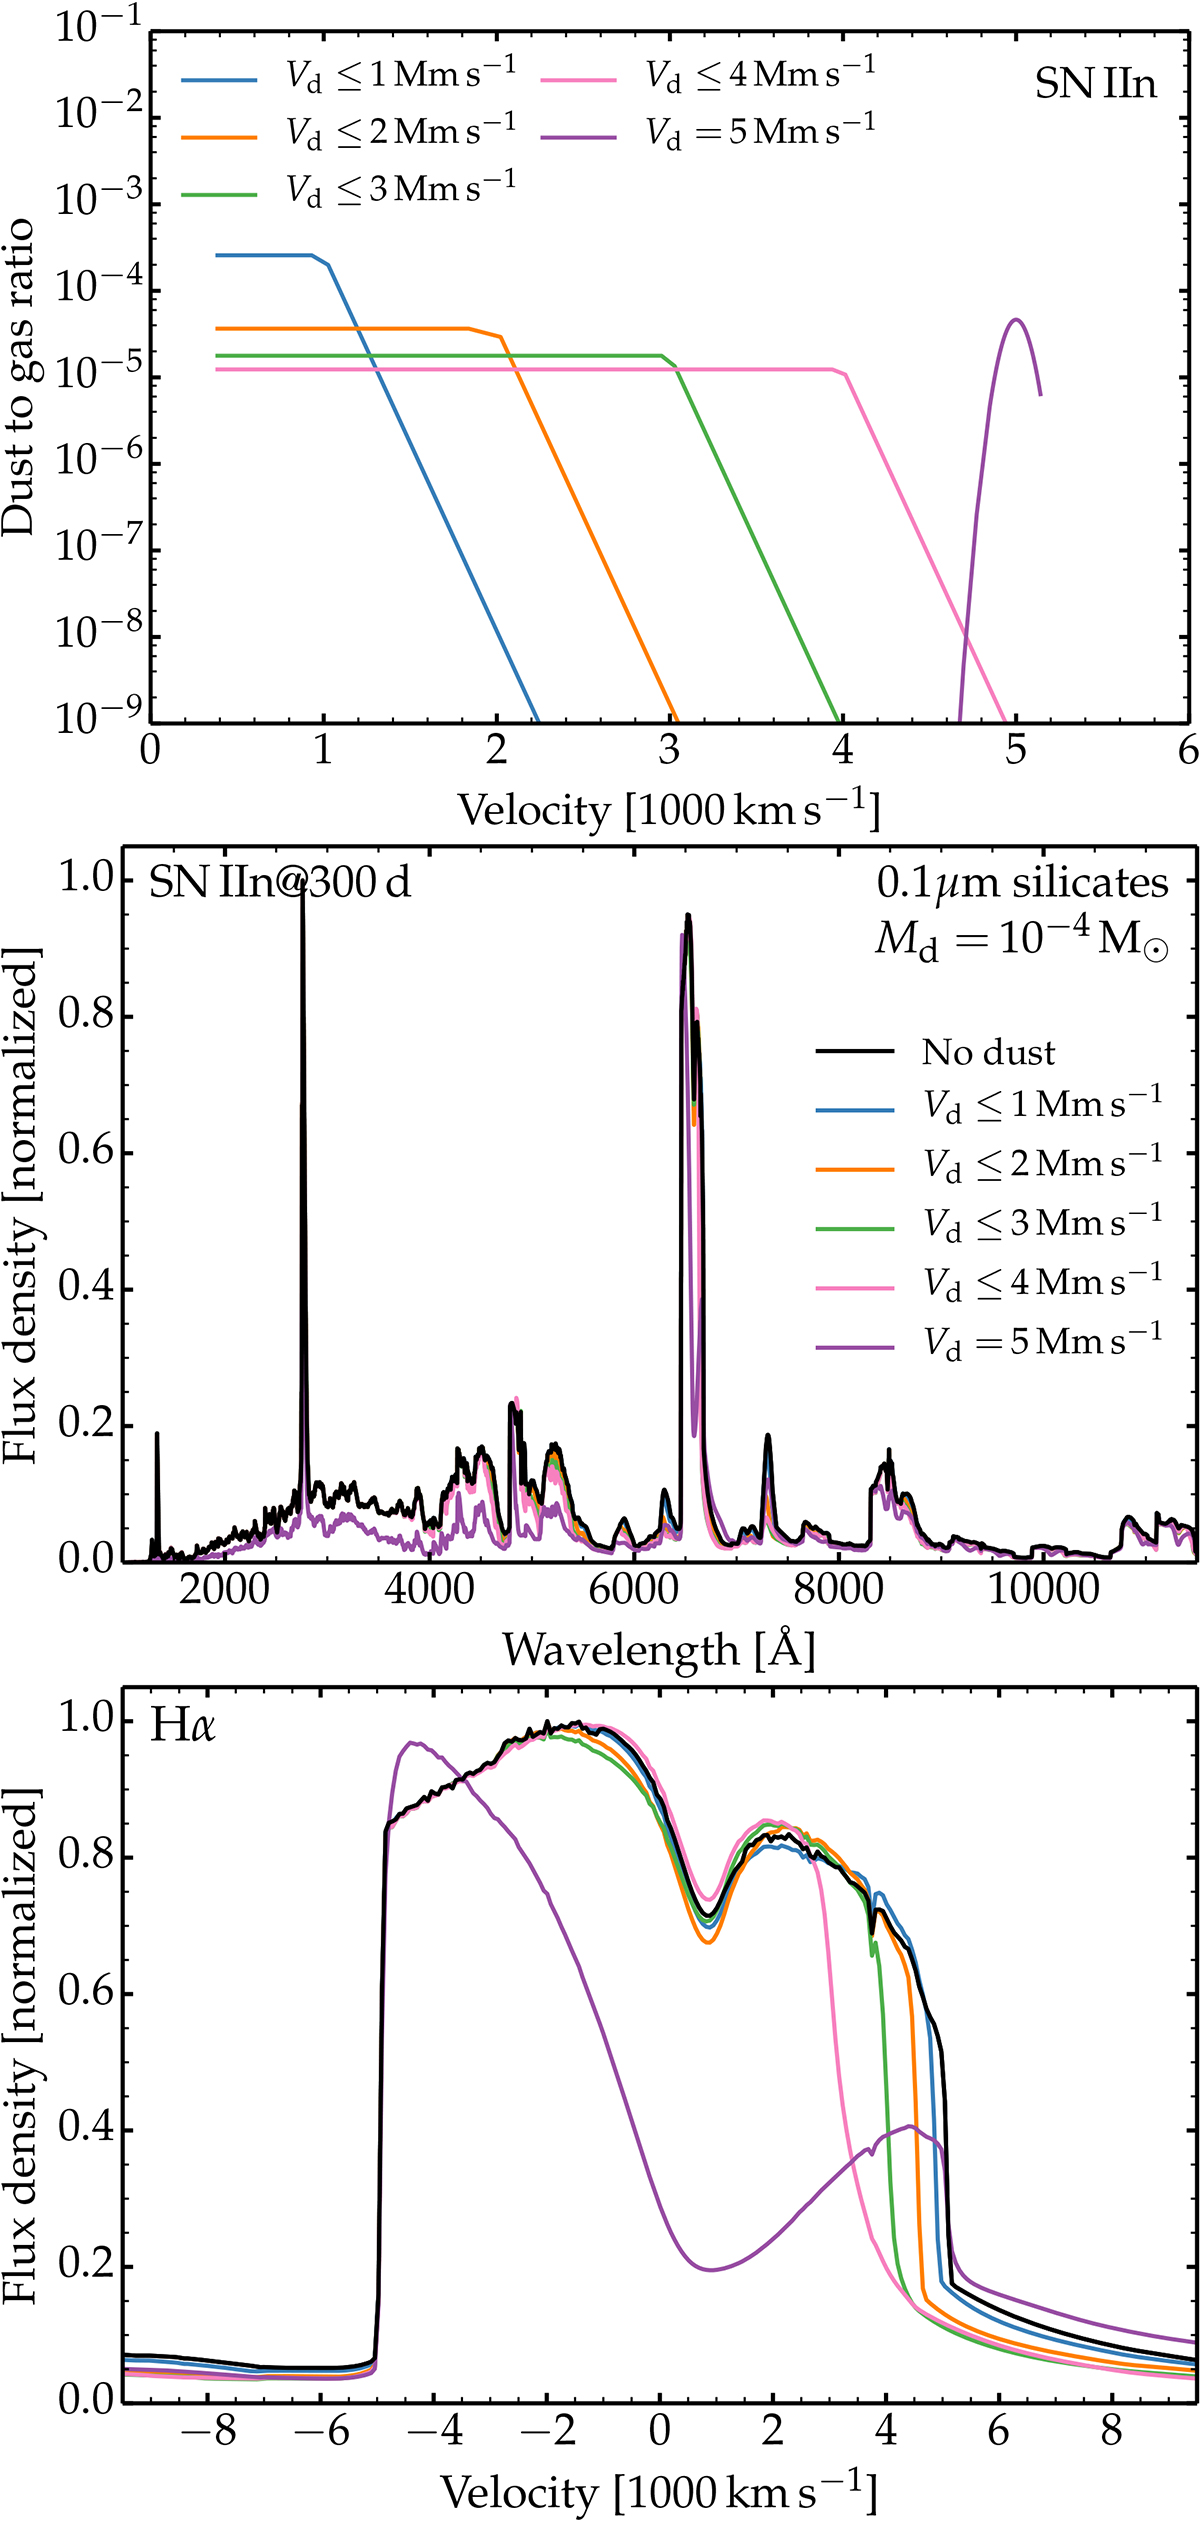
Impact of the dust location on the spectral properties of the SN IIn model at 300 d. We show various choices for the dust spatial distribution (top) and the corresponding predictions for the resulting optical spectrum (middle) and the Hα profile (bottom). The dust is made of 0.1μm silicate grains and the total dust mass is 10−4 M⊙. [See Sect. 5 for discussion.]
Current usage metrics show cumulative count of Article Views (full-text article views including HTML views, PDF and ePub downloads, according to the available data) and Abstracts Views on Vision4Press platform.
Data correspond to usage on the plateform after 2015. The current usage metrics is available 48-96 hours after online publication and is updated daily on week days.
Initial download of the metrics may take a while.