Fig. 8
Download original image
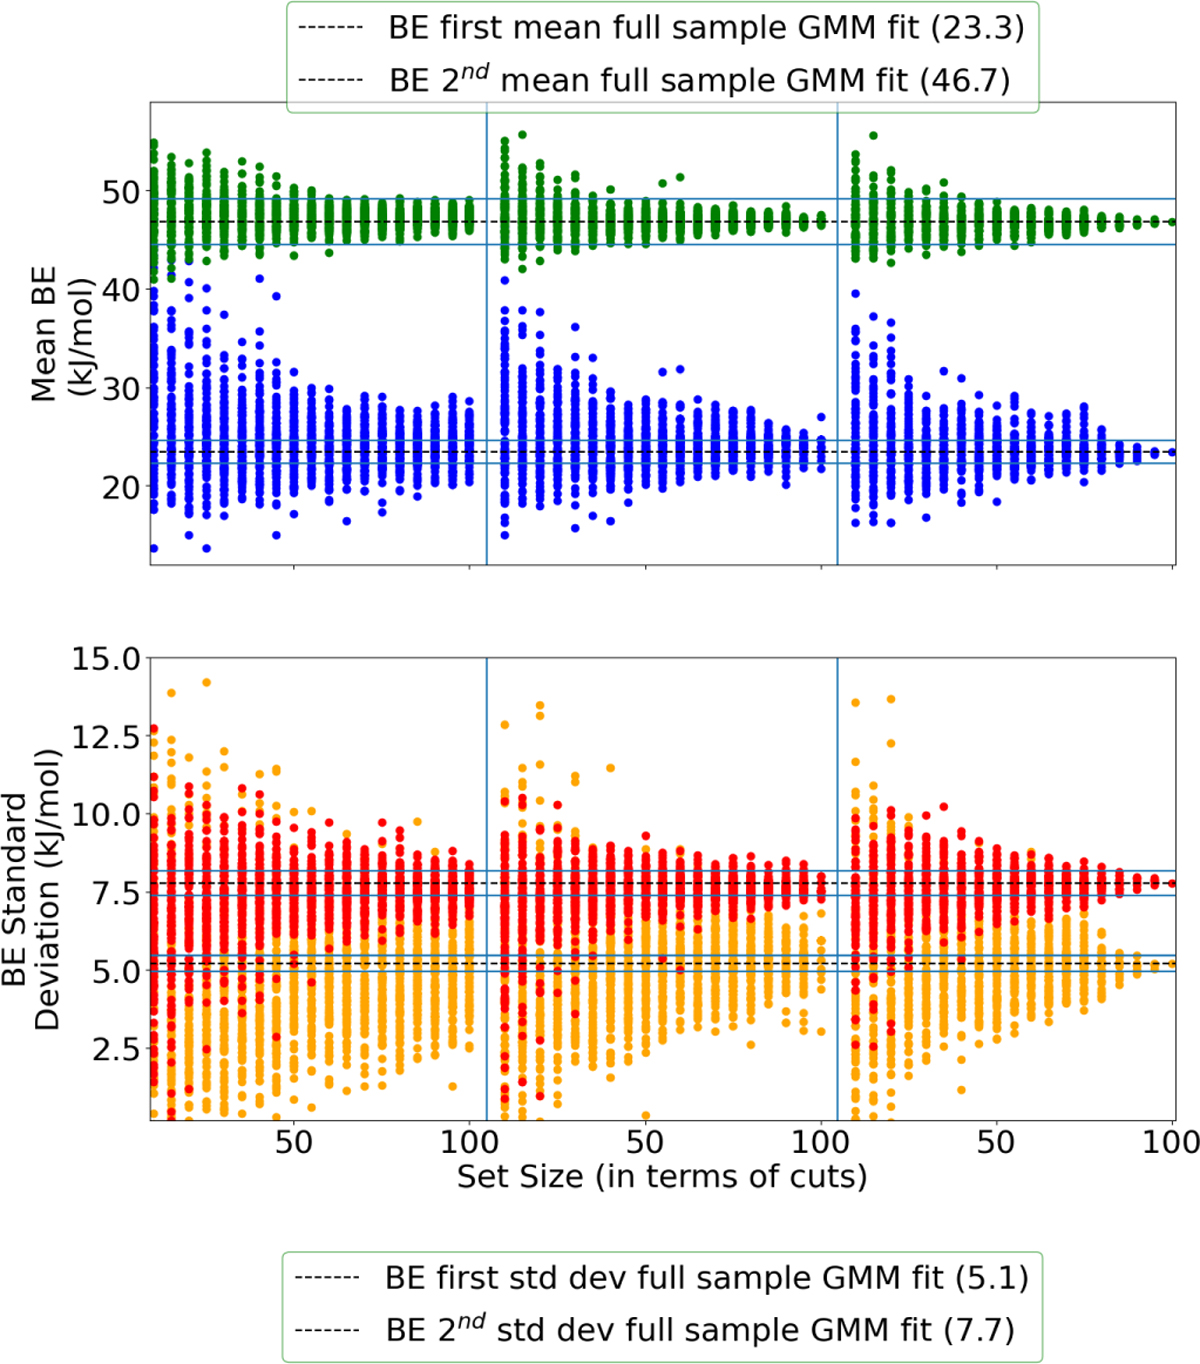
Bootstrapping analysis of GMM two components statistics of NH3 BE distribution, with increasing set size. The set size definition depends on the number of picked adsorbate orientation per cut, increasing from 1 to 3 from the left to the right. The dashed line represents the statistics for the full set of data, while the continuous lines encompass a tolerance interval of 5% around these statistics.
Current usage metrics show cumulative count of Article Views (full-text article views including HTML views, PDF and ePub downloads, according to the available data) and Abstracts Views on Vision4Press platform.
Data correspond to usage on the plateform after 2015. The current usage metrics is available 48-96 hours after online publication and is updated daily on week days.
Initial download of the metrics may take a while.