Fig. 3
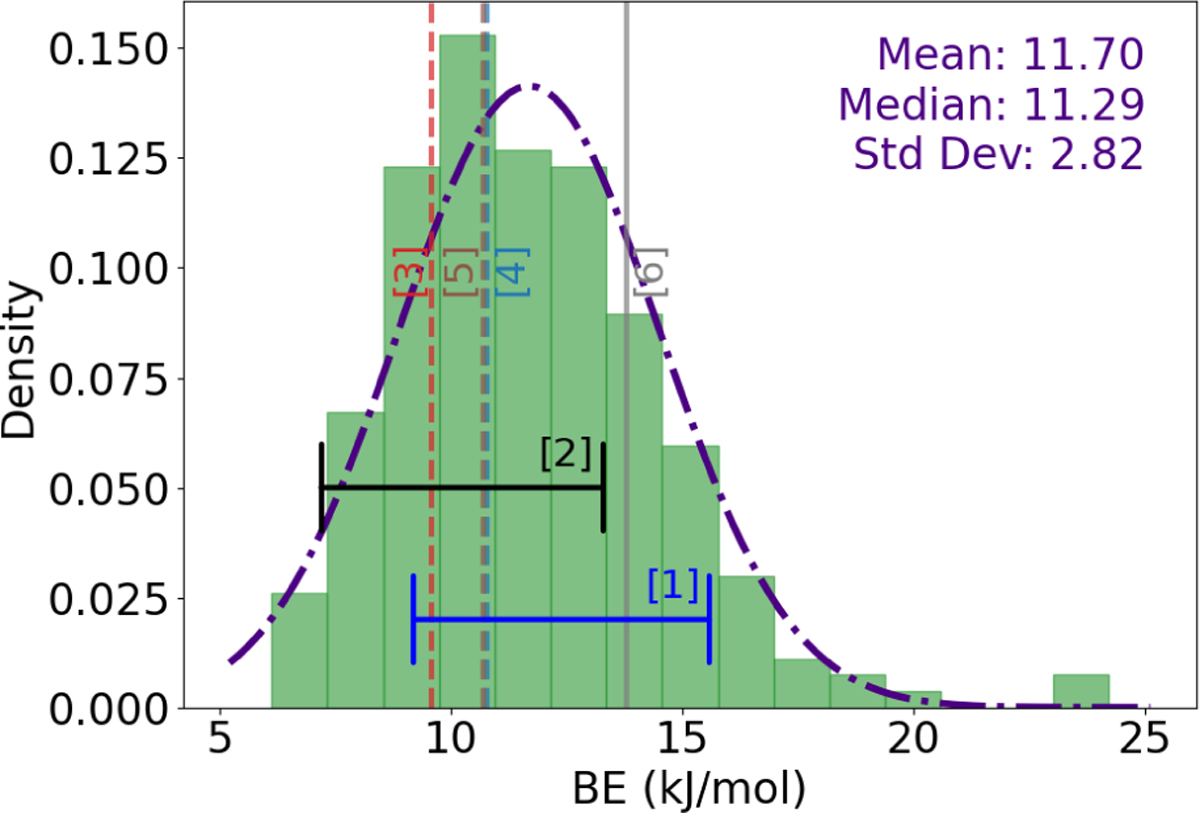
Download original image
Normalized histogram of sampled BEs (in kJ/mol) for CO, fitted with a single component gaussian profile. Previously reported results of CO BE values onto water ice analogs with diverse simulation methods are given on top. See Fig. 2 for the meaning of horizontal intervals, vertical dashed lines, and the plain gray line. Ref: [1] Ferrero et al. (2020); [2] He et al. (2016) and Penteado et al. (2017); [3] UMIST; [4] Wakelam et al. (2017)/KIDA, [5] Das et al. (2018); [6] Ferrero et al. (2020) on crystalline ice.
Current usage metrics show cumulative count of Article Views (full-text article views including HTML views, PDF and ePub downloads, according to the available data) and Abstracts Views on Vision4Press platform.
Data correspond to usage on the plateform after 2015. The current usage metrics is available 48-96 hours after online publication and is updated daily on week days.
Initial download of the metrics may take a while.