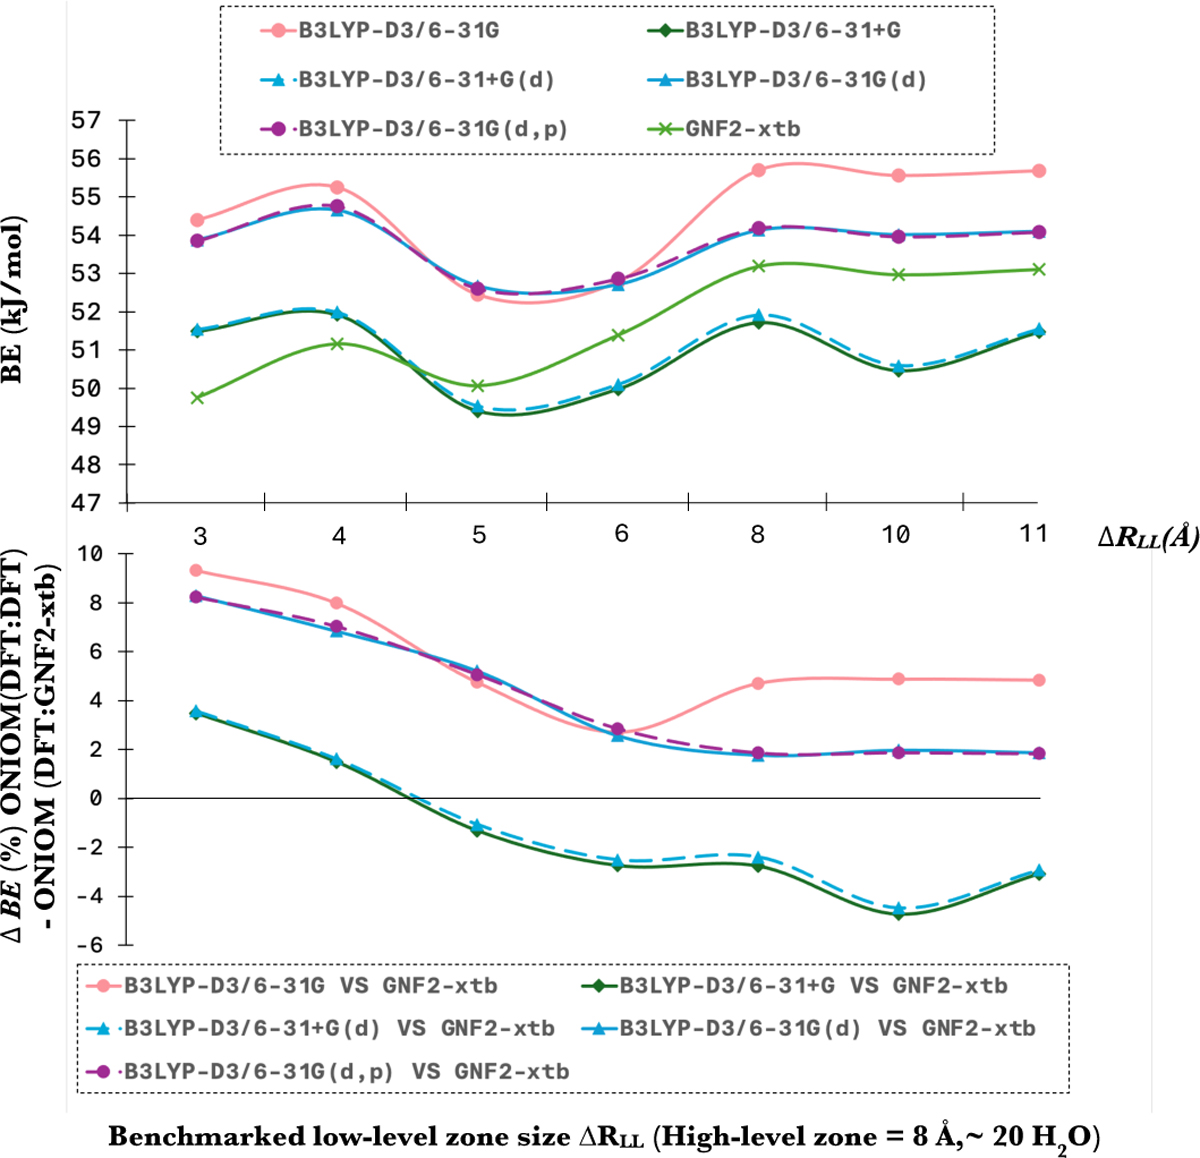
Fig. D.1
Download original image
Top panel – NH3 BE for a growing ΔRLL and various low-levels of theory. The different series hold for a computational scheme following ONIOM(B3LYP-D3/6-311+G(d,p): x), where x , the low-level method, accounts for either for B3LYP-D3/growing basis set (see legend), or GFN2-xtb; Bottom panel – residue graph representing the relative difference between ONIOM(B3LYP-D3/6-311+G(d,p):GFN2-xtb) and ONIOM(B3LYP-D3/6-311+G(d,p): B3LYP-D3/growing basis set). Note that legends only explicit the low-level method of each series, for the sake of clarity. Lines do not represent any interpolated physical trends, they only serve as guides to highlight the trend and facilitate the reader view of the plots.
Current usage metrics show cumulative count of Article Views (full-text article views including HTML views, PDF and ePub downloads, according to the available data) and Abstracts Views on Vision4Press platform.
Data correspond to usage on the plateform after 2015. The current usage metrics is available 48-96 hours after online publication and is updated daily on week days.
Initial download of the metrics may take a while.