Open Access
Fig. C.2.
Download original image
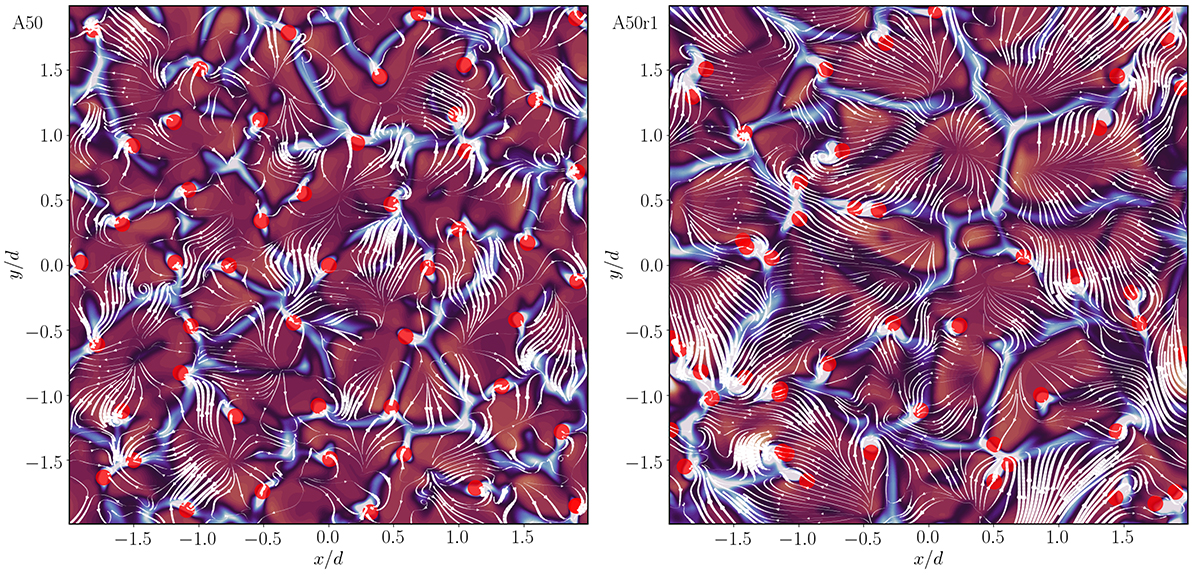
Vertical velocity uz (colour contours) and horizontal flows (white arrows) near the surface at z/d = 0.85 from Runs A50 (left) and A50r1 (right), averaged over ten snapshots during a time interval of ![]() or about 1.3τconv. The red circles show the positions of the cooling patches.
or about 1.3τconv. The red circles show the positions of the cooling patches.
Current usage metrics show cumulative count of Article Views (full-text article views including HTML views, PDF and ePub downloads, according to the available data) and Abstracts Views on Vision4Press platform.
Data correspond to usage on the plateform after 2015. The current usage metrics is available 48-96 hours after online publication and is updated daily on week days.
Initial download of the metrics may take a while.