Fig. 1.
Download original image
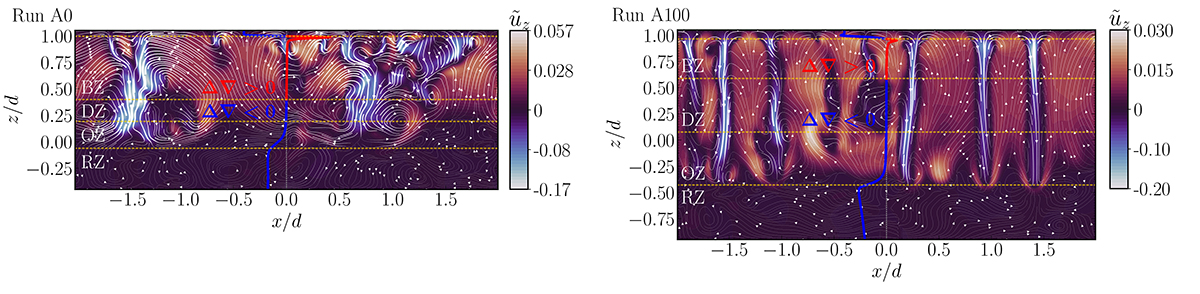
Vertical slices showing the flows from Runs A0 (left) and A100 (right). Note that the box is deeper in the latter case. The colour contours indicate the vertical velocity, uz. The tilde refers to normalisation by ![]() . The arrows map streamlines where the linewidth reflects the flow speed. The blue and red curves indicate the superadiabatic temperature gradient, Δ∇, with negative (positive) values in blue (red). The boundaries of different zones as defined in Table 1 are indicated by the corresponding labels and orange dotted lines.
. The arrows map streamlines where the linewidth reflects the flow speed. The blue and red curves indicate the superadiabatic temperature gradient, Δ∇, with negative (positive) values in blue (red). The boundaries of different zones as defined in Table 1 are indicated by the corresponding labels and orange dotted lines.
Current usage metrics show cumulative count of Article Views (full-text article views including HTML views, PDF and ePub downloads, according to the available data) and Abstracts Views on Vision4Press platform.
Data correspond to usage on the plateform after 2015. The current usage metrics is available 48-96 hours after online publication and is updated daily on week days.
Initial download of the metrics may take a while.