Fig. 8
Download original image
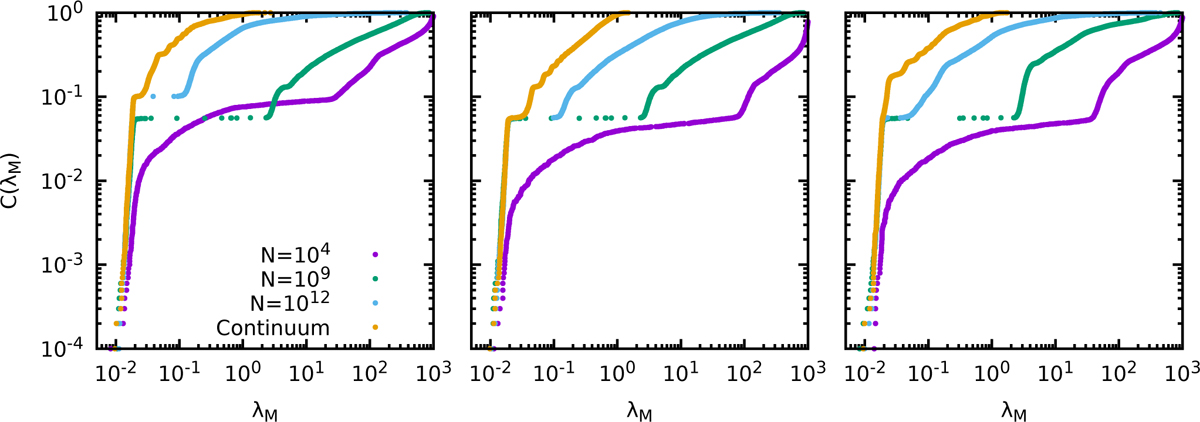
Cumulative distribution of the tracer orbits larger Lyapunov exponents for (from left to right) a self-similar collapse, a steepening of the inner density profile, and a collapse with strengthening of the central density cusp. The different sets of points mark the N = 104 (purple), N = 109 (green), N = 1012 (teal), and the continuum limit (orange).
Current usage metrics show cumulative count of Article Views (full-text article views including HTML views, PDF and ePub downloads, according to the available data) and Abstracts Views on Vision4Press platform.
Data correspond to usage on the plateform after 2015. The current usage metrics is available 48-96 hours after online publication and is updated daily on week days.
Initial download of the metrics may take a while.