| Issue |
A&A
Volume 683, March 2024
|
|
|---|---|---|
| Article Number | A254 | |
| Number of page(s) | 11 | |
| Section | Extragalactic astronomy | |
| DOI | https://doi.org/10.1051/0004-6361/202348313 | |
| Published online | 22 March 2024 | |
Dissipationless collapse and the dynamical mass–ellipticity relation of elliptical galaxies in Newtonian gravity and MOND
1
National Council of Research – Institute of Complex Systems (CNR-ISC), Via Madonna del piano 10, 50019 Sesto Fiorentino, Italy
e-mail: This email address is being protected from spambots. You need JavaScript enabled to view it.
2
National Institute of Nuclear Physics (INFN) – Florence unit, Via G. Sansone 1, 50019 Sesto Fiorentino, Italy
3
Department of Physics and Astronomy, University of Florence, Piazzale E. Fermi 2, 50125 Firenze, Italy
4
National Institute of Astrophysics – Arcetri Astrophysical Observatory (INAF-OAA), Piazzale E. Fermi 5, 50125 Firenze, Italy
Received:
18
October
2023
Accepted:
5
February
2024
Abstract
Context. Recent observational studies proposed an empirical relation between the dark-to-total mass ratio and ellipticity in elliptical galaxies based on their observed total dynamical mass-to-light ratio data M/L = (14.1 ± 5.4)ϵ. In other words, the larger the content of dark matter in the galaxy, the more the stellar component will be flattened. If true, this observation appears to be in stark contrast with the commonly accepted galaxy formation scenario, whereby this process takes place inside dark halos with reasonably spherical symmetry.
Aims. Comparing the processes of dissipationless galaxy formation in different theories of gravity and the emergence of the galaxy scaling relations therein provides an important framework within which, in principle, one can discriminate between these processes.
Methods. By means of collisionless N-body simulations in modified Newtonian dynamics (MOND) and Newtonian gravity with and without active dark matter halos, with both spherical and clumpy initial structure, I study the trends of intrinsic and projected ellipticities, Sérsic index, and anisotropy with the total dynamical-to-stellar mass ratio.
Results. I show that the end products of both cold spherical collapses and mergers of smaller clumps show an increasing departure from spherical symmetry for increasing values of the total dynamical-to-stellar mass ratio, at least in a range of halo masses. The equivalent Newtonian systems of the end products of MOND collapses show a similar behaviour. However, the M/L relation obtained from the numerical experiments in both gravities is rather different from that reported by Deur and coauthors.
Key words: gravitation / methods: numerical / galaxies: evolution / galaxies: formation
© The Authors 2024
 Open Access article, published by EDP Sciences, under the terms of the Creative Commons Attribution License (https://creativecommons.org/licenses/by/4.0), which permits unrestricted use, distribution, and reproduction in any medium, provided the original work is properly cited.
This article is published in open access under the Subscribe to Open model. This email address is being protected from spambots. You need JavaScript enabled to view it. to support open access publication.
1. Introduction
In the ΛCDM scenario, stellar systems such as galaxies and clusters are thought to be embedded in dark matter (DM) halos, accounting for the missing mass fraction evidenced by velocity dispersion or rotational velocity measures (e.g. see Bertin 2014). DM halos are usually assumed to be spherically symmetric structures in collisionless equilibrium with radial densities well fitted by the Navarro et al. (1997, Navarro–Frenk–White; NFW) profile originally obtained from cosmological dissipationless collapse simulations (see Dubinski & Carlberg 1991).
In the context of spheroids, such as elliptical galaxies and the bulges of disc galaxies, the interplay between the DM density distribution ρDM and that of the stellar component ρ* has attracted a lot of interest, in particular with respect to the widely studied cusp–core problem (Moore 1994). That is, the observed rotation curves of dwarf galaxies imply a flat-cored halo (i.e. vanishing logarithmic density slope at inner radii) in contrast with the cuspy (i.e. diverging DM density at r → 0) distributions predicted by DM N-body simulations, such as the NFW profile (e.g. see Oh et al. 2015). In addition, it can also be proved analytically that flat cored models cannot admit consistent phase-space distributions when embedded in cuspy halos, except in a small range of values of the central anisotropy profile (see Ciotti 1999, see also Ciotti & Pellegrini 1992).
Several explanations for the core–cusp problem have been proposed, ranging from the effect of stellar evolution feedback (Di Cintio et al. 2014; Brook et al. 2014; Genina et al. 2018; Katz et al. 2018; Burger & Zavala 2021) to extra channels for dissipation, implying that the flattening of the central DM density distribution is due the intrinsic nature of the DM (e.g. the so-called self-interacting DM; Baldi & Salucci 2012; Kahlhoefer et al. 2019; Sánchez Almeida & Trujillo 2021; Burger et al. 2022). Some authors also suggested a misinterpretation of the observational data on dwarf galaxies (McGaugh et al. 2003; Valenzuela et al. 2007). Moreover, in the context of modified theories of gravity, alternatives to the DM hypothesis, such as the modified Newtonian dynamics (MOND; Milgrom 1983), explain the core-cusp problem as an artefact of the gravity model (see e.g. Eriksen et al. 2021; Sánchez Almeida 2022; Re & Di Cintio 2023).
Although much work has been devoted to the interplay between the slopes of the dark and visible matter density profiles and their implications for the anisotropy profile, much less is known about the relationship between the DM profile and the intrinsic shape of the stellar component, namely its ellipticity ϵ. Deur (2014, 2020) and more recently Winters et al. (2023), using a broad sample of elliptical galaxies from independent surveys, and different methods to evaluate the mass-to-light ratio M/L (i.e. Virial theorem, Bacon et al. 1985; anisotropic Jeans modelling, Cappellari 2008; Pechetti et al. 2017; gravitational lensing, Bolton et al. 2008; Auger et al. 2010; Shu et al. 2017; gas disc dynamics, Bertola et al. 1991, 1993; Pizzella et al. 1997; X-ray emission spectra, Jin et al. 2020, and the dynamics of satellite star clusters or companion galaxies, Alabi et al. 2017; Harris et al. 2019; Chen & Hwang 2020), observed that the two quantities are related by the linear relation
 (1)
(1)
In the equation above, the mass-to-light ratio is normalised such that M/L(ϵ2D = 0.3)≡8 M⊙/L⊙ ≡ 4M/M*(ϵ2D = 0.3), and the intrinsic ellipticity ϵ is inferred from its apparent 2D-projected value ϵ2D in the assumption of oblateness and a Gaussian distribution of projection angles θ from
 (2)
(2)
Equation (1) implies that (at least for the galaxies examined) a larger contribution of the DM mass MDM to the total mass M corresponds to a larger departure from spherical symmetry (i.e. larger ellipticity). The lower DM fraction in rounder galaxies could be, in principle, perceived as being in stark contrast with the standard scenario of galaxy formation1, requiring that the baryons aggregate and form structure in dark matter halos that had collapsed at earlier times. However, notably, some peculiar elliptical galaxies (though excluded by the original sample of Winters et al. 2023), such as the dwarf (Mateo 1998) or ultrafaint dwarf galaxies (Simon 2019), appear to go against the trend given by Eq. (1), as they are characterised by a rather spherical shape (ϵ ≤ 0.1) while being DM dominated with M/L up to 102 or more. A factor governing the mass ratio–ellipticity relation could be related to the departure from spherical symmetry of the halos themselves and its relation to their total DM content. Indeed, several studies (both observational and numerical; see e.g. Jing & Suto 2002; Ragone-Figueroa et al. 2010; Vera-Ciro et al. 2011; Bett 2012; Schneider et al. 2012; Rojas-Niño et al. 2015; Evslin 2016; Gonzalez et al. 2022) point out that more massive halos have significantly higher departure from spherical symmetry. More recently, Re & Di Cintio (2023) performed N-body simulations in MOND, showing that the equivalent Newtonian systems (ENS; i.e. stellar systems with a dark halo such that the total Newtonian gravitational potential is the same as the parent MOND model) to the end products of cold gravitational collapses are consistent with Eq. (1) if the initial conditions are sufficiently clumpy.
The origin of the triaxiality of (single-component) gravitational systems, forming via direct collapse from nearly spherical initial conditions, is usually ascribed to the process of radial-orbit instability2 (ROI; see Polyachenko & Shukhman 1981; Palmer & Papaloizou 1987; Bertin et al. 1994; Maréchal & Perez 2010), where an initially minor departure from spherical symmetry grows by accreting particles on low-angular-momentum orbits (Allen et al. 1990). This explanation is supported by numerical experiments (Merritt & Aguilar 1985; Bellovary et al. 2008; Barnes et al. 2009; Gajda et al. 2015; Di Cintio et al. 2017; Di Cintio & Casetti 2020; Weinberg 2023).
The ROI is stronger in models with a larger degree of radial anisotropy3, which is quantified (see e.g. Binney & Tremaine 2008, see also Fridman & Poliachenko 1984) by the parameter
 (3)
(3)
where Kr and Kt = Kθ + Kϕ are the radial and tangential components of the kinetic energy tensor, respectively, given by
 (4)
(4)
where  and
and  are the radial and tangential phase-space averaged square velocity components. Typically, single-component models have been found to be (numerically) stable for ξ ≲ 1.7 (e.g. see Nipoti et al. 2002), while some authors put a larger threshold for stability at ξ ≲ 2.3 (see Meza & Zamorano 1997, see also Maréchal & Perez 2011).
In stellar systems with a DM halo, the latter has often been indicated as having a stabilising effect against ROI, however numerical experiments seem to weaken this hypothesis (Stiavelli & Sparke 1991; Nipoti et al. 2011). In general, even if the total amount of anisotropy is large, an extended isotropic core does indeed reduce the ROI, as shown by Trenti & Bertin (2006). Moreover, a locally fluctuating halo potential has, in principle, different effects on the ignition of the ROI at fixed ξ for different baryon profiles, as conjectured by Di Cintio & Casetti (2021).
Simple N-body simulations of dissipationless collapse, merger, or instability growth in anisotropic equilibria have been rather successful in reproducing the scaling laws of elliptical galaxies and the fundamental plane itself (see e.g. the work by Nipoti et al. 2002, 2003, 2006). It is therefore natural to ask whether highly idealised collisionless numerical simulations could reproduce Eq. (1). In this work, I use collisionless N-body simulations in Newtonian and MOND gravities to investigate the implications of dissipationless collapse in the emergence of the M/L–ϵ relation. The paper is structured as follows. In Sect. 2, I discuss the initial conditions, the numerical codes, and the analysis of the simulation outputs. In Sect. 3, the results of the simulations are presented and interpreted. In Sect. 4, I draw conclusions.
2. Models and methods
2.1. Properties of initial conditions
The numerical simulations of dissipationless collapse presented in this paper (in both Newtonian and MOND paradigms) are characterised by two types of initial conditions, namely spherically symmetric initial states or clumpy baryon distributions. In all Newtonian simulations, when present, the DM halos are always initially spherical. Such halos have been implemented either with particles or with a smooth non-evolving density distribution, exerting a fixed potential. All simulated systems are assumed to be isolated so that any effect of the environment in their shape can be excluded, and in accordance with the explicit exclusion of group galaxies in the samples analysed by Deur (2014) and Winters et al. (2023).
The positions for the particles of the given component (baryons or DM) in spherical systems were sampled from the so-called γ-models (Dehnen 1993, see also Tremaine et al. 1994), which are defined by the density profile
 (5)
(5)
The density ρi above is therefore defined by the total mass Mi, scale radius rc, i, and logarithmic density slope γ. In this work, I discuss mainly the γ = 0 and γ = 1 (i.e. the Hernquist 1990 model) cases, corresponding to a flat-cored and a moderately cuspy distribution, respectively. Using the density distribution (5), instead of the widely adopted NFW (or its alternatives, such as the Einasto 1965 profile, which can model a finite cusp or core; see also Retana-Montenegro et al. 2012), keeps the number of model parameters limited to the density slope γ, the mass ratio M/M*, and the scale radii, which are fixed, while preserving both the “cosmological” central density ρ0(r)∝1/r and the large radii 1/r3 fall off.
Similarly to previous studies (e.g. see Londrillo et al. 2003; Nipoti et al. 2006; Di Cintio et al. 2013, and references therein), baryonic particle velocities were sampled from a position-independent isotropic Maxwell–Boltzmann distribution and were then normalised in order to get the wanted value of the virial ratio in the range 0 ≤ 2K/|W|≤0.2. The simulations shown here are limited to 2K/|W| = 10−3. When considering a virialised live halo with (initial) density ρDM, the velocities of the DM particles are obtained by sampling with the usual rejection method, that is, the ergodic phase-space distribution function f(ℰ) evaluated numerically with the standard Eddington (1916) inversion as
 (6)
(6)
where, ℰ = v2/2 − Φ(r) is the specific energy for unit mass and the total potential Φ = Φ* + ΦDM, where the stellar and DM potentials Φ* and ΦDM are given for a γ-model by
![Mathematical equation: $$ \begin{aligned} \Phi _i(r)=\frac{{GM}_{i}}{r_{c,{i}}(2-\gamma )}\left[\left(\frac{r}{r+r_{c,{i}}}\right)^{2-\gamma }-1\right];\quad i=*,\mathrm{DM}. \end{aligned} $$](/articles/aa/full_html/2024/03/aa48313-23/aa48313-23-eq9.gif) (7)
(7)
Clumpy initial conditions have been implemented following Hansen et al. (2006). First a root γ = 1 model is generated, and then NC clumps – also described by the density (5), with different choices of the scale radius rc–, and density slope γ are generated with centres having Poissonian displacements from the root Hernquist model. When present, the DM halo is initialised as above for the spherical collapse. Again, stellar particle velocities are selected from an isotropic Maxwellian and are later normalised to obtain the desired value of 2K/|W|. MOND systems, as they lack a DM component, are characterised by the dimensionless κ parameter, defined by  , where a0 ≈ 10−8 cm s−2 is the MOND scale acceleration (Milgrom 1983), which means that, for κ ≫ 1, one recovers the Newtonian regime, while for κ ≲ 1 the system is in the MONDian regime.
Throughout this work, a constant mass-to-light ratio for the stellar component is adopted so that, in computer units M*/L = 1 for all models. As a consequence, Eq. (1) is hereafter expressed in terms of M/M*. All properties of the initial conditions presented in this work are summarised in Table 1.
Summary of the simulation properties.
2.2. Numerical codes
The Newtonian N-body simulations discussed here were performed with the publicly available FVFPS code (FORTRAN version of a fast Poisson solver, Londrillo et al. 2003) using a parallel version of the classical Barnes & Hut (1986) tree scheme for the force evaluation combined with the Dehnen (2002) fast multipole method (see also Dehnen & Reed 2011). The simulations span a range of N = N* + NDM (i.e. the total number of simulation particles) between 104 and 106 (see Cols. 2 and 3 in Table 1 below). In the lowest-resolution cases (here N = 104), only stars are simulated with particles and the DM halo (when present) is always modelled as an external fixed potential (see Eq. (7)).
The gravitational forces are smoothed below a cut-off distance given by the so-called softening length (see Dehnen 2001) in the range 0.02 ≤ ϵsoft ≤ 0.05 in units of the initial rc, *. MOND systems were simulated using the NMODY modified Poisson solver (for the details see Londrillo & Nipoti 2011, see also Nipoti et al. 2007) applying an iterative relaxation procedure on a spherical grid4, starting from a seed guess solution (in the same fashion as the standard Newtonian Poisson solvers; see Londrillo & Messina 1990; Londrillo et al. 1991) to evaluate the gravitational potential from the non-linear Poisson equation (Bekenstein & Milgrom 1984):
![Mathematical equation: $$ \begin{aligned} \nabla \cdot \left[\mu _M\left(\frac{||\nabla \Phi ||}{a_0}\right)\nabla \Phi \right]=4\pi G\rho . \end{aligned} $$](/articles/aa/full_html/2024/03/aa48313-23/aa48313-23-eq11.gif) (8)
(8)
The MOND interpolation function μ(x) is assumed hereafter to be
 (9)
(9)
yielding the usual asymptotic limits
 (10)
(10)
which for ||∇Φ|| ≫ a0 Eq. (8) essentially recover the Poisson equation of the Newtonian regime, while for ||∇Φ|| ≪ a0 the system is in the so-called deep-MOND (often labelled as dMOND) regime5 with Eq. (8) simplifying to
![Mathematical equation: $$ \begin{aligned} \nabla \cdot \left[||\nabla \Phi ||\nabla \Phi \right]=4\pi G\rho a_0. \end{aligned} $$](/articles/aa/full_html/2024/03/aa48313-23/aa48313-23-eq14.gif) (11)
(11)
All simulations were extended up to t = 300tDyn, where, as above, we define the half mass dynamical time,
 (12)
(12)
for which rh is the radius containing half of the total system mass M = M* + MDM in Newtonian models or M = M* in MOND models and single-component Newtonian models. By doing so, it is ensured that the collective oscillations are sufficiently damped out and the virial ratio of the bound matter 2K/|W|≃1. Particles are propagated with a second-order leapfrog scheme with an adaptive time step (see Hut et al. 1995) Δt that varies during each run as  , where ρmax(t) is the time-dependent maximal density and η is the so-called Courant–Friedrichs–Lewy condition, which in the simulations discussed here was fixed to 0.3.
2.3. Structural analysis of the end products
For the sets of simulations introduced above, projected and intrinsic properties were evaluated in the standard way (see e.g. Nipoti et al. 2006; Di Cintio et al. 2013 and references therein). Once the end products are translated to the centre-of-mass frame, the particles undergo three random rotations, and the rotated system is then projected in the plane perpendicular to the three putative lines of sight. The 2D ellipticities are obtained as ϵ2D = 1 − 𝜚, where in each of the three projections, 𝜚 = b2D/a2D is the ratio between the minimum and maximum projected semiaxis.
To have a measure of the concentration of the model, the angle-averaged two-dimensional density profiles Σ(R) were fitted with the Sérsic (1968) law
![Mathematical equation: $$ \begin{aligned} \Sigma (R)=\Sigma _e e^{-b\left[\left(\frac{R}{R_e}\right)^{1/m}-1\right]}, \end{aligned} $$](/articles/aa/full_html/2024/03/aa48313-23/aa48313-23-eq17.gif) (13)
(13)
where Σe is the projected mass density at effective radius Re, which is the radius of the circle containing half of the projected mass. As the two dimensionless parameters b and m are related by b ≃ 2m − 1/3 + 4/405m (see Ciotti & Bertin 1999), Eq. (13) can be fitted with the single parameter m. I reiterate that, for high values of m, the density profile is steep in the central regions and shallow in the outer, while low values of m correspond to shallow central density profiles with steeper outer slopes.
The intrinsic triaxiality of the end products is recovered by evaluating the second-order tensor6
 (14)
(14)
for the particles inside the spheres of radius r50, r70, and r90 containing 50%, 70%, and 90% of the stellar mass of the system, respectively.
The matrix Iij is diagonalised iteratively, with the requirement that the percentage difference of the largest eigenvalue between two consequent iterations does not exceed 10−3. On average, for N ≈ 105, the process requires about ten iterations. Once the three eigenvalues I1 ≥ I2 ≥ I3 are recovered, a rotation is applied to the system such that the three eigenvectors are oriented along the coordinate axes. For a heterogeneous ellipsoid of semiaxes a, b, and c, one has I1 = Aa2, I2 = Ab2, and I3 = Ac2, where A is a constant depending on the density profile. The axial ratios are defined by  and
and  , meaning that the ellipticities in the principal planes are
 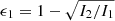 and
and 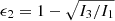 . Models with c/a ∼ b/a ≲ 0.5 are defined as prolate; models for which c/a ∼ b/a ≳ 0.5 are defined as oblate; while models with b/a > 0.5 and c/a < 0.5 are found to be triaxial.
For the end products of the MOND simulations, the (bona fide) ENS is recovered with the same procedure as that used by Re & Di Cintio (2023), that is, by evaluating the angle-averaged (spherical) density profile on a radial grid from which the Newtonian and MOND force fields gN and gM are recovered. The DM density of the ENS is then obtained as
 (15)
(15)
I note that Eq. (15) above is only valid for isolated spherical systems, as in any other geometry, substituting the source term in Eq. (8) with the Poisson equation ΔΦN = 4πGρ and integrating out the divergence term on both sides yields
 (16)
(16)
where S ≡ ∇ × h(ρ) is a density-dependent solenoidal field.
The DM content MDM of the ENS is finally obtained by integrating Eq. (15) from 0 up to the radius of the farmost particle so that the total dynamical mass of the model is again M = M* + MDM.
3. Simulations and results
3.1. Projected properties
For three random projections (indicated with differently sized symbols), Fig. 1 (left panel) shows the 2D ellipticites of the end products of spherical collapses in frozen (squares) and live (circles) halos as well as baryon-only MOND (diamonds) collapses versus the mass ratio on a log scale. In all cases, both baryons and DM (when present) start from Hernquist density profiles with the same scale radius rs and N = 105. The stellar systems produced in collapses within frozen halos show a somewhat increasing trend of M/M* with ϵ2D (or vice versa), though the linear relation and its associated uncertainty – given in Eq. (1) and marked in the figure by the dashed line and the (orange) shaded area – is not produced. Collapses in initially virialized live halos seem to produce systems with a smaller departure from the spherical symmetry at low or rather large (up to ∼102) M/M*, with a maximum value of ϵ2D for M/M* ∼ 3. Remarkably, for the random projections shown here, at fixed mass ratio, ϵ2D is systematically smaller for the products of the collapses in live halos. MOND collapses show a somewhat intermediate behaviour, attaining large values of the projected ellipticity (around ϵ2D ∼ 0.6) for dynamical-to-baryon mass ratios of order 102.
 |
Fig. 1. Mass ratio M/M* as a function of the 2D ellipticity ϵ2D measured on three random projections (indicated with increasingly large symbol size) for the end products of models with initially cold (K0 = 0) Hernquist profiles (γ = 1) with frozen (squares) and live (circles) Hernquist DM halos and in MOND (diamonds) (see rows 7, 9, and 22 in Table 1), and as a function of the deprojected ellipticity for different choices of the inclination angle θ (dots) and their average value (right panel). For comparison, in both panels the dashed line and the orange shaded area mark the Deur (2014) relation, while the vertical red dashed lines indicate the limit ellipticity 0.7. |
For comparison, in the right panel of Fig. 1, the mass ratio is plotted against the estimated intrinsic minimal ellipticity ϵ3D recovered by inverting Eq. (2) for the intermediate value of ϵ2D whilst assuming oblateness for a Gaussian distribution of the assumed projection angle θ (points). The mean value of ϵ3D for 30 independent realisations of θ is marked by the symbols, with the same coding as in the left panel. Again, the dashed curve and the orange shaded area highlight Eq. (1). Although the point distributions present an increasing trend of M/M* with ϵ3D, the deprojected ellipticities still fail to reproduce the linear relation observed by Deur (2014) and Winters et al. (2023). However, it is worth noting that some MOND systems and Newtonian systems with a frozen halo are intrinsically prolate (see discussion below), which contradicts the oblateness assumption in applying Eq. (2).
The final states attained after starting from different sets of Newtonian initial conditions (i.e. clumpy, γ = 0 flat cored initial baryon profiles, not shown here) do not show radically different projected ellipticity trends. Figure 2 presents the Sersić index m as a function of M/M*. Most models, independently on the specific value of the mass ratio, have indexes in the range of 1.1 ≲ m ≲ 7, which is compatible with the values for the observed elliptical galaxies (e.g. see Zahid & Geller 2017; Sonnenfeld et al. 2019; Sonnenfeld 2019 and references therein). Collapses of initially spherical distributions in frozen halos produce remarkably large Sersić indexes at high M/M*, with values of up to ∼9 and 12.3 for initially cuspy γ = 1 or flat cored γ = 0 baryon profiles, respectively. For M/M* ≲ 40, the γ = 1 initial condition in a frozen halo produces final values of m ∼ 4, corresponding to a de Vaucouleurs (1948) profile.
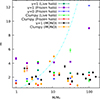 |
Fig. 2. Sérsic index m as a function of the total to baryonic matter ratio for the end products of collapses with frozen and live DM halos, as well as dynamical to baryonic matter in MOND simulations for the simulations with parameters given in rows (7, 9, 18, 19, and 22) of Table 1. The cyan dot-dashed line marks the relation emerging from the observational data of Sonnenfeld et al. (2019). |
The Sérsic indexes of MOND models starting from both spherical (diamonds) and clumpy (pentagons) initial conditions do not show a clear trend with the ratio of dynamical to stellar mass, with initially spherical systems yielding a narrower span of values around m ∼ 2. Notably, MOND clumpy initial conditions could produce extremely centrally shallow final projected profiles with m down to ≈0.89 for M/M* ≈ 50 (corresponding to κ ∼ 10). Sonnenfeld et al. (2019) found for their sample of spheroids that  and
and  , which roughly correspond to m ∝ (M/M* − 1)0.66, indicated in Fig. 2 by the dotted-dashed line. With the notable exception of the spherical collapses in frozen halos, whose end products exhibit an increasing trend of m with M/M*, the other sets of simulations fall outside the trend of the Sérsic index with M/M* when the latter exceeds ≈30. Notably, M/M* ≈ 30 is also the maximum value of the mass ratio explored in the samples used by Sonnenfeld et al. (2019).
3.2. Intrinsic properties
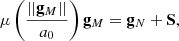
As in the N-body simulations discussed here the total dynamical-to-stellar mass ratio is essentially the control parameter, it is convenient to show the intrinsic minimum ellipticity ϵ as a function of M/M*. In Fig. 3, ϵ is plotted against M/M* for Newtonian simulations with spherical (γ = 1, left panel) and clumpy (right panel) initial conditions for the baryons. In all cases, the DM halo is, at least initially, simulated with a γ = 1 model.
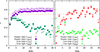 |
Fig. 3. Intrinsic ellipticity ϵ as a function of M/M* for initially cold spherical systems in live (circles) and frozen (squares) halos (left panel); and for initially cold clumpy systems in live (downward triangles) and frozen (upward triangles) halos (right panel). The empty and filled symbols refer to ϵ evaluated inside r70% and r90%, respectively. The simulation parameters are summarised in rows (14–17) of Table 1. |
Initially spherical systems collapsing in a frozen halo with central ρDM ∝ 1/r (indicated in figure by empty and filled squares) relax to flatter end states for increasing M/M*, eventually tending to ϵ ≈ 0.8. For mass ratios M/M* ≳ 5, such end states are significantly more flattened than an E7 galaxy (indicated by the dashed line at ϵ = 0.7) at the Lagrangian radii enclosing both 70% (empty symbols) and 90% (filled symbols) of M*. When the halo is live (i.e. modelled using particles, shown by the circles in Fig. 3) the picture is rather different and the ellipticity shows a non-monotonic trend with the mass ratio M/M*. Curiously, ϵ starts to decrease at around M/M* ≈ 5, the value for which ϵ(M/M*) settles to a somewhat constant value for the frozen halo simulations. Spherical collapses in cored halos (i.e. with γ = 0, not shown here) show essentially the same behaviour as their counterparts with a cusp; although for the cases where the halo is frozen, the limit value of ϵ at increasing M/M* is at around 0.7.
Clumpy initial conditions in spherical halos yield end products that show a qualitative trend of ϵ with M/M*, similar to their spherical counterparts when the DM halo is frozen (though with a larger scatter of ϵ at bigger mass ratios). Vice versa, a live halo almost always induces mildly flattened end states, around ϵ ≈ 0.3 for M/M* ≳ 6, while a somewhat non-monotonic trend is evident at low mass ratios.
The final DM halo ellipticities ϵDM have been evaluated for all live halo simulations. In general, for N* = NDM = 5 × 10⁴ one has 0.93 ≲ ϵDM ≲ 0.98, implying that the collapse of the baryon distribution does not significantly alter the sphericity of the virialised halo, while its central regions become significantly more “cored” at later times, when M/M* ≲ 6. This could, in principle, be a numerical collisionality artefact induced by the simulation resolution (i.e. number of particles used for DM and stars, and particle mass ratio μ = mDM/m*). For example, Fig. 4 shows the final DM (left panel) and stellar (right panel) density profiles for different realisations of a model with initial γ = 1 halo and star density profiles with M/M* = 5 and various choices of particle resolution ranging from μ = 5 to 0.167 (i.e. the individual mass of DM particles spans from values larger than that of the particles representing the stellar component to significantly lower). In both sets of density profiles, the curves differ significantly from one another at radii smaller than r/rc, * ∼ 10−2. In particular, the halo density ρDM becomes increasingly cored for higher DM resolutions7 (i.e. larger NDM and smaller μ at fixed M/M*). Surprisingly, in that case, the associated ρ* is strikingly similar to that obtained for the frozen halo simulation (downward- and upward-pointing triangles in the right panel). We see similar behaviour for lower values of M/M* and clumpy initial conditions for the initial stellar distribution.
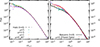 |
Fig. 4. Density profiles at t = 300tDyn for halo (left panel) and baryons (right panel) for μ = 5 (squares), 2.5 (circles), 1 (diamonds), 0.167 (triangles), and 0 (downward triangles). The dashed and solid lines mark the initial profiles (γ = 1 in both cases) for DM and baryons, respectively. The simulation parameters are summarised in row (20) of Table 1. |
Figure 5 shows ϵ as a function of M/M* in MOND simulations (corresponding to rows 22 and 23 in Table 1) where the effective total dynamical mass M is obtained as discussed in Sect. 2.3. Spherical collapses starting from cuspy initial conditions with γ = 1 and various values of the parameter κ always produce relaxed end states with 0.4 ≲ ϵ ≲ 0.7. Between M/M* = 1 and ≈14, ϵ has a markedly increasing trend, though nowhere linear as claimed in Deur (2014) and Winters et al. (2023) and observed in the MOND N-body simulations by Re & Di Cintio (2023). However, the latter simulations were limited to κ = 1 and 100 cases only, but with different values of the initial virial ratio 2K/|W|. Clumpy systems (as for their Newtonian counterparts) have a rather flat trend of ϵ with a few outliers for values of the mass ratio smaller than M/M* ≈ 5, corresponding to simulations with an initial value of κ ≈ 500. Curiously, for spherical initial conditions, the minimal ellipticity is obtained in correspondence of the trend inversion.
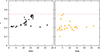 |
Fig. 5. Same as Fig. 3 but for MOND systems with γ = 1 (left) and clumpy (right) initial conditions, corresponding to the simulation parameters summarised in rows (22 and 23) of Table 1. |
Newtonian and MOND systems starting from similar initial conditions have qualitatively different intrinsic triaxiality, as summarised in Fig. 6, where the final ratio of the minimum to maximum semiaxis c/a is plotted against the ratio of the intermediate to maximum semiaxis b/a. In general, as also observed in Nipoti et al. (2007, 2011), single-component Newtonian collapses mostly produce marginally oblate systems, while the end products of MOND collapses are in general slightly prolate or triaxial. Here we observe that when a (frozen) DM halo is added (squares in Fig. 6), Newtonian end states often become markedly prolate, in particular for M/M* > 20 (as colour coded in Fig. 6), in particular when c/a falls below 0.3 (as indicated by the red dashed line), corresponding to ellipticities larger than the threshold value of ϵ = 0.7 for an E7 galaxy. Newtonian collapses in live halos (circles) mostly produce oblate (at large M/M*) or mildly triaxial systems (for low values of M/M*). The MOND simulations performed here typically produce oblate end states for effective M/M* ≲ 6 and markedly prolate end states for 6 ≲ M/M* ≲ 35. Larger values of the effective mass ratio (associated to values of κ < 10 in the initial condition) generally produce strongly triaxial systems, without any evident differences between cored, cuspy, and clumpy initial mass distributions.
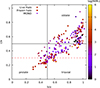 |
Fig. 6. Minimum vs. maximum axial ratios for the end products of Newtonian collapses in live (circles) and frozen (squares) halos, and MOND collapses for the different values of the logarithm of the mass ratio M/M* listed in Col. 4 of Table 1 (colour bar). |
Independently of the specific gravity model used (Newtonian or MOND), as a general trend, the simulations performed in this work yield increasingly radially anisotropic states for larger values of ϵ, up to ξ ∼ 26.5 for Newtonian models collapsing in frozen halos. Typically, increasing values of M/M* lead to larger final ξ. In Fig. 7 (cf. also Fig. 7 in Re & Di Cintio 2023), the anisotropy parameter ξ is shown as function of ϵ for various choices of M/M*, as indicated by the colour map. MOND models stand out as being able to attain rather large values of ξ for intermediate values of ϵ (around 0.45) and small values of their effective dynamical-to-stellar mass ratio, M/M*. As shown by the time evolution of ξ (top panel) and the axial ratios (bottom panels) of Fig. 8, for γ = 1 systems, MOND models (red and purple dashed lines) reaching comparable values of the anisotropy index to that of Newtonian systems with a frozen halo8 (line 7 in Table 1) become considerably more flattened over a shorter period of dynamical time. We note that, for a given stellar mass M*, MOND systems have dynamical timescales that are significantly different from those of comparable Newtonian models with a DM halo (cf. Eq. (12)), with MONDian collective timescales being typically longer (Nipoti et al. 2007). I also note that MOND systems attaining similar values of ξ to the Newtonian models with M/M* = 2 and 1 have slightly larger dynamical-to-stellar mass ratios (≈4 and 1.7, respectively). It should also be borne in mind that, when converted into physical units, the timescales of Fig. 8 may differ significantly from one another. For example, using the halo-to-stellar-mass relation of Sonnenfeld et al. (2019) (see also Tinker et al. 2017), with a scale ratio of 100 kpc, the dynamical time for Newtonian (baryons plus DM) systems would range from ≈1.3 Gyr down to ≈0.06 Gyr for mass ratios in the range of 2 ≲ M/M* ≲ 30, spanning an interval of luminous masses of between 1010 and 1012 M⊙.
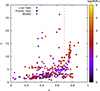 |
Fig. 7. Anisotropy parameter inside r70% as a function of ϵ for the end products of the simulations. As in Fig. 6, the colour code maps the (logarithmic) mass ratio M/M* listed in Col. 4 of Table 1. |
As expected, in both paradigms of gravity explored here, initially cold spherical models (2K/|W|≪1) become rapidly (i.e. below 1tDyn) radially anisotropic and undergo a process akin to the ROI for unstable equilibrium systems, and once relaxed appear triaxial or flattened. In the Newtonian cases, the higher the mass ratio M/M*, the higher the initial (and final) value of ξ (top panel in Fig. 8). This leads to the suggestion that a spherical or almost spherical preformed DM halo induces strongly radially unstable initial states for the stellar or baryonic component, at least within an interval of M/M*. For fixed mass ratios and a fixed halo density profile, the end products of cold clumpy initial conditions are systematically less anisotropic than their initially spherical counterparts. In MOND collapses, on the contrary, clumpy initial conditions tend to produce systems with larger values of ξ than those that are spherical to begin with, with comparable “phantom” DM evaluated from Eq. (15), reaching similar final values of ϵ.
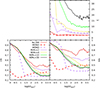 |
Fig. 8. Evolution of the anisotropy parameter ξ (top right panel) and axial ratios c/a (bottom left) and c/a (bottom right) for different Newtonian models in frozen halos (solid lines, row 7 in Table 1) and MOND models (dashed lines). |
4. Summary and discussions
With an aim to shed light on the origin of the ellipticity–dynamical mass relation, I performed N-body simulations of dissipationless collapse in both Newtonian gravity with dark matter and MOND. In general, the products of most numerical experiments, in agreement with previous studies with analogous initial conditions, have Sérsic index values, radial anisotropy, and density profiles in ranges comparable to those of the observed elliptical galaxies.
The Newtonian and MOND simulations discussed here both show that, at least for values of the mass ratio M/M* (intrinsic or effective in the case of MOND) of between 5 and 6, disipationless collapse alone produces a certain increasing trend with the ellipticity of the spheroid. However, the linear proportionality (cf. Eq. (1)) discussed by Deur (2014) and later by Winters et al. (2023) could not be recovered in either of the two paradigms of gravity considered here, that is, with intrinsic ellipticities or their deprojected values estimated with Eq. (2).
In particular, in Newtonian simulations with a frozen DM halo, the values of ϵ at the Lagrangian radii enclosing 90% of the stellar mass “saturate” at around 0.75 for M/M* larger than 6. Of course, this is most likely a numerical effect due to the rather unphysical fixed halo assumption. For the Newtonian simulations where a live DM halo was considered, an unequivocal non-monotonic relation between ϵ and M/M* (and hence M/L if a constant L/M* is assumed) is observed. In particular, a tendency to produce less flattened end states when M/M* exceeds ≈20 is observed for spherical initial conditions. It is therefore tempting to hypothesise that at even larger mass ratios the end products of Newtonian collapses should be almost spherical, as one would expect for the case of ultrafaint dwarf galaxies where M/M* may exceed 102 (e.g. Zoutendijk et al. 2021). However, we must be aware that for a given mass ratio, the end products of live halo simulations could be influenced by resolution. Indeed, with increasing resolution (i.e. decreasing values of μ) when regarding spherical collapses, the final models tend to depart more from spherical symmetry. MOND models interpreted in the context of a DM scenario (i.e. when the halo of the associated ENS is accounted for) also present an increasing trend of ϵ with M/M* below M/M* ≈ 10; this is in partial contrast with the simulations of Re & Di Cintio (2023), which are limited to a single value of 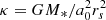 , yielding a monotonic and quasi-linear trend between the quantities.
Prompted by recent results on the relation between stellar and halo masses and the Sérsic index of the stellar component (see Sonnenfeld et al. 2019), m was evaluated for the Newtonian and MOND simulation outputs. Remarkably, MOND collapses (both clumpy and spherical) are found to be able to produce systems with m order unity (corresponding to an extremely shallow core) without invoking any dissipative mechanism, which is at variance with the Newtonian simulations of Nipoti (2015), where clumpy initial conditions were used with the power-spectrum index n as a control parameter. Clumpy initial conditions in Newtonian simulations with frozen halos can also attain low values of m; however, in such cases this is likely a numerical artefact. Independently of the specific nature of the initial baryon distribution, live DM halos flatten down to ϵ ∼ 0.06 (retaining an oblate 3D structure) and have their central cusp significantly lowered for systems starting with initial conditions characterized by a clumpy stellar component, which qualitatively confirms what has been noted for the two-component Newtonian simulations of Cole et al. (2011); see also Pascale et al. (2023). The increasing trend of m with M/M* deducible from Sonnenfeld et al. (2019) is observed only below M/M* ∼ 30. However, systems with larger dynamical-to-luminous matter ratios were not in the samples analysed by these latter authors.
In summary, the results listed above point towards the fact that, in a certain span of halo masses in units of the visible matter total mass M*, the increasing trend between M/M* and the flattening ϵ could be a consequence of the dissipationless collapse. The fact that an unequivocal linear relation is not recovered can be ascribed to the uncertainty on the measurements or the deprojection procedure for ϵ, and/or to the strong assumptions made on the mass-to-light ratio of the visible matter. Moreover, the non-monotonicity in the trend between ϵ and M/M* in some simulation setups is not at all in contrast with the observed ellipticals. The qualitative interpretation that emerges is that, the deeper the (total) potential well during the collapses, the stronger the radial orbit instability and therefore the stronger the departure of the final state from spherical symmetry. For extremely large M/M*, the baryonic matter behaves essentially as tracer particles within the halo potential. If the latter has a rather spherical shape, the stellar component barely departs from it, as no ROI takes place.
Most importantly, one has to bear in mind that Eq. (1) is defined for an ensemble that explicitly excludes certain systems, such as ultrafaint dwarfs, which by definition fall outside an increasing trend of M/M* with ϵ. From the point of view of modified Newtonian dynamics (MOND), evaluating the dark mass content of the ENS of the end states of MONDian simulations reveals that a relation akin to Eq. (1) could also be supported in a modified dynamics scenario. As a by-product of this work, it appears that in MOND, sufficiently clumped initial conditions can yield flattened and centrally shallow spheroids even in the absence of dissipation, as opposed to Newtonian collapses with DM requiring some form of dissipation.
A natural follow-up to this study, in the context of Newtonian gravity, would focus necessarily on the effects of an initially non-virialised halo as well as clumpy DM distributions, which are not considered here for reasons of simplicity. For what concerns MOND (and possibly other alternative theories without DM), the interplay between the clumpyness of the initial (baryonic) density and the initial acceleration regime (i.e. how below or above a0) should also be explored.
I note that, on the contrary, globular clusters are essentially spherical while not containing a significant fraction of DM.
Some authors (see Joyce et al. 2009; Worrakitpoonpon 2015; Sylos Labini et al. 2015; Benhaiem et al. 2016) also suggest the angular momentum loss via particle escape during the violent phases of gravitational collapse as a viable channel for the loss of spherical symmetry.
Though extensively studied for anisotropic equilibrium models (Polyachenko et al. 2011, and references therein), the ROI is also at play in an initially far-from-equilibrium setting (Trenti et al. 2005), undergoing violent relaxation (Lynden-Bell 1967), such as that seen in the early phases of the collapse of initially cold systems.
As a rule, here the grid was fixed to 128 × 32 × 64 nodes.
It is worth noting that it is not guaranteed that a given system is in the dMOND regime at all radii, nor that it will continue to be so when evolving from an initial condition in this state; Nipoti et al. (2007).
I note that Iij is not the inertia tensor, which is given instead by Tr(Iij)δij − Iij.
In principle, the DM-resolution-related issues could be probed using the effective multi-component models introduced by Nipoti et al. (2021).
Newtonian models with a live halo could in principle exchange orbital anisotropy between the two components via spurious (numerical) collisional processes, in particular in the central regions where the resolution is, by construction, scarce.
Acknowledgments
I would like to express gratitude to Federico Re, Carlo Nipoti and Stefano Zibetti for the useful discussions at an early stage of this work. The Referee is also acknowledged for his/her suggestions that helped improving the presentation of the results. I am also wishing to acknowledge funding by “Fondazione Cassa di Risparmio di Firenze” under the project HIPERCRHEL for the use of high performance computing resources at the University of Firenze.
References
- Alabi, A. B., Forbes, D. A., Romanowsky, A. J., et al. 2017, MNRAS, 468, 3949 [Google Scholar]
- Allen, A. J., Palmer, P. L., & Papaloizou, J. 1990, MNRAS, 242, 576 [NASA ADS] [CrossRef] [Google Scholar]
- Auger, M. W., Treu, T., Bolton, A. S., et al. 2010, ApJ, 724, 511 [NASA ADS] [CrossRef] [Google Scholar]
- Bacon, R., Monnet, G., & Simien, F. 1985, A&A, 152, 315 [NASA ADS] [Google Scholar]
- Baldi, M., & Salucci, P. 2012, JCAP, 2012, 014 [CrossRef] [Google Scholar]
- Barnes, J., & Hut, P. 1986, Nature, 324, 446 [NASA ADS] [CrossRef] [Google Scholar]
- Barnes, E. I., Lanzel, P. A., & Williams, L. L. R. 2009, ApJ, 704, 372 [NASA ADS] [CrossRef] [Google Scholar]
- Bekenstein, J., & Milgrom, M. 1984, ApJ, 286, 7 [NASA ADS] [CrossRef] [Google Scholar]
- Bellovary, J. M., Dalcanton, J. J., Babul, A., et al. 2008, ApJ, 685, 739 [NASA ADS] [CrossRef] [Google Scholar]
- Benhaiem, D., Joyce, M., Sylos Labini, F., & Worrakitpoonpon, T. 2016, A&A, 585, A139 [NASA ADS] [CrossRef] [EDP Sciences] [Google Scholar]
- Bertin, G. 2014, Dynamics of Galaxies (Cambridge, UK: Cambridge University Press) [Google Scholar]
- Bertin, G., Pegoraro, F., Rubini, F., & Vesperini, E. 1994, ApJ, 434, 94 [NASA ADS] [CrossRef] [Google Scholar]
- Bertola, F., Bettoni, D., Danziger, J., et al. 1991, ApJ, 373, 369 [Google Scholar]
- Bertola, F., Pizzella, A., Persic, M., & Salucci, P. 1993, ApJ, 416, L45 [NASA ADS] [CrossRef] [Google Scholar]
- Bett, P. 2012, MNRAS, 420, 3303 [Google Scholar]
- Binney, J., & Tremaine, S. 2008, Galactic Dynamics: Second Edition (Princeton University Press) [Google Scholar]
- Bolton, A. S., Burles, S., Koopmans, L. V. E., et al. 2008, ApJ, 682, 964 [Google Scholar]
- Brook, C. B., Di Cintio, A., Knebe, A., et al. 2014, ApJ, 784, L14 [NASA ADS] [CrossRef] [Google Scholar]
- Burger, J. D., & Zavala, J. 2021, ApJ, 921, 126 [NASA ADS] [CrossRef] [Google Scholar]
- Burger, J. D., Zavala, J., Sales, L. V., et al. 2022, MNRAS, 513, 3458 [NASA ADS] [CrossRef] [Google Scholar]
- Cappellari, M. 2008, MNRAS, 390, 71 [NASA ADS] [CrossRef] [Google Scholar]
- Chen, C.-Y., & Hwang, C.-Y. 2020, ApJ, 903, 38 [NASA ADS] [CrossRef] [Google Scholar]
- Ciotti, L. 1999, ApJ, 520, 574 [NASA ADS] [CrossRef] [Google Scholar]
- Ciotti, L., & Bertin, G. 1999, A&A, 352, 447 [NASA ADS] [Google Scholar]
- Ciotti, L., & Pellegrini, S. 1992, MNRAS, 255, 561 [NASA ADS] [CrossRef] [Google Scholar]
- Cole, D. R., Dehnen, W., & Wilkinson, M. I. 2011, MNRAS, 416, 1118 [NASA ADS] [CrossRef] [Google Scholar]
- Dehnen, W. 1993, MNRAS, 265, 250 [NASA ADS] [CrossRef] [Google Scholar]
- Dehnen, W. 2001, MNRAS, 324, 273 [NASA ADS] [CrossRef] [Google Scholar]
- Dehnen, W. 2002, J. Comput. Phys., 179, 27 [NASA ADS] [CrossRef] [Google Scholar]
- Dehnen, W., & Reed, J. 2011, Eur. Phys. J. Plus, 126, 55 [NASA ADS] [CrossRef] [Google Scholar]
- Deur, A. 2014, MNRAS, 438, 1535 [NASA ADS] [CrossRef] [Google Scholar]
- Deur, A. 2020, arXiv e-prints [arXiv:2010.06692] [Google Scholar]
- de Vaucouleurs, G. 1948, Ann. Astrophys., 11, 247 [Google Scholar]
- Di Cintio, P., & Casetti, L. 2020, MNRAS, 494, 1027 [NASA ADS] [CrossRef] [Google Scholar]
- Di Cintio, P., & Casetti, L. 2021, in Multi-Scale (Time and Mass) Dynamics of Space Objects, eds. A. Celletti, C. Beaugé, C. Gales, & A. Lemâitre, IAUS Proc. Ser., 364 [Google Scholar]
- Di Cintio, P., Ciotti, L., & Nipoti, C. 2013, MNRAS, 431, 3177 [NASA ADS] [CrossRef] [Google Scholar]
- Di Cintio, A., Brook, C. B., Macciò, A. V., et al. 2014, MNRAS, 437, 415 [Google Scholar]
- Di Cintio, P., Ciotti, L., & Nipoti, C. 2017, MNRAS, 468, 2222 [NASA ADS] [CrossRef] [Google Scholar]
- Dubinski, J., & Carlberg, R. G. 1991, ApJ, 378, 496 [Google Scholar]
- Eddington, A. S. 1916, MNRAS, 76, 572 [NASA ADS] [CrossRef] [Google Scholar]
- Einasto, J. 1965, Trudy Astrofiz. Inst. Alma-Ata, 5, 87 [NASA ADS] [Google Scholar]
- Eriksen, M. H., Frandsen, M. T., & From, M. H. 2021, A&A, 656, A123 [NASA ADS] [CrossRef] [EDP Sciences] [Google Scholar]
- Evslin, J. 2016, ApJ, 826, L23 [NASA ADS] [CrossRef] [Google Scholar]
- Fridman, A. M., & Poliachenko, V. L. 1984, Physics of Gravitating Systems. II – Nonlinear Collective Processes: Nonlinear Waves, Solitons, Collisionless Shocks, Turbulence. Astrophysical Applications (Springer, Berlin) [Google Scholar]
- Gajda, G., Łokas, E. L., & Wojtak, R. 2015, MNRAS, 447, 97 [NASA ADS] [CrossRef] [Google Scholar]
- Genina, A., Benítez-Llambay, A., Frenk, C. S., et al. 2018, MNRAS, 474, 1398 [NASA ADS] [CrossRef] [Google Scholar]
- Gonzalez, E. J., Hoffmann, K., Gaztañaga, E., et al. 2022, MNRAS, 517, 4827 [NASA ADS] [CrossRef] [Google Scholar]
- Hansen, S., Moore, B., Zemp, M., & Stadel, J. 2006, JCAP, 0601, 014 [NASA ADS] [Google Scholar]
- Harris, G. L. H., Babyk, I. V., Harris, W. E., & McNamara, B. R. 2019, ApJ, 887, 259 [NASA ADS] [CrossRef] [Google Scholar]
- Hernquist, L. 1990, ApJ, 356, 359 [Google Scholar]
- Hut, P., Makino, J., & McMillan, S. 1995, ApJ, 443, L93 [NASA ADS] [CrossRef] [Google Scholar]
- Jin, Y., Zhu, L., Long, R. J., et al. 2020, MNRAS, 491, 1690 [NASA ADS] [Google Scholar]
- Jing, Y. P., & Suto, Y. 2002, ApJ, 574, 538 [Google Scholar]
- Joyce, M., Marcos, B., & Sylos Labini, F. 2009, MNRAS, 397, 775 [Google Scholar]
- Kahlhoefer, F., Kaplinghat, M., Slatyer, T. R., & Wu, C.-L. 2019, JCAP, 2019, 010 [CrossRef] [Google Scholar]
- Katz, H., Desmond, H., Lelli, F., et al. 2018, MNRAS, 480, 4287 [NASA ADS] [CrossRef] [Google Scholar]
- Londrillo, P., & Messina, A. 1990, MNRAS, 242, 595 [NASA ADS] [CrossRef] [Google Scholar]
- Londrillo, P., & Nipoti, C. 2011, Astrophysics Source Code Libraryhttps://ascl.net/1102.001 [Google Scholar]
- Londrillo, P., Messina, A., & Stiavelli, M. 1991, MNRAS, 250, 54 [NASA ADS] [Google Scholar]
- Londrillo, P., Nipoti, C., & Ciotti, L. 2003, Mem. Soc. Astron. Ital. Suppl., 1, 18 [Google Scholar]
- Lynden-Bell, D. 1967, MNRAS, 167, 101 [NASA ADS] [CrossRef] [Google Scholar]
- Maréchal, L., & Perez, J. 2010, MNRAS, 405, 2785 [Google Scholar]
- Maréchal, L., & Perez, J. 2011, Transport Theor. Stat. Phys., 40, 425 [CrossRef] [Google Scholar]
- Mateo, M. L. 1998, ARA&A, 36, 435 [NASA ADS] [CrossRef] [Google Scholar]
- McGaugh, S. S., Barker, M. K., & de Blok, W. J. G. 2003, ApJ, 584, 566 [CrossRef] [Google Scholar]
- Merritt, D., & Aguilar, L. A. 1985, MNRAS, 217, 787 [Google Scholar]
- Meza, A., & Zamorano, N. 1997, ApJ, 490, 136 [NASA ADS] [CrossRef] [Google Scholar]
- Milgrom, M. 1983, ApJ, 270, 365 [Google Scholar]
- Moore, B. 1994, Nature, 370, 629 [NASA ADS] [CrossRef] [Google Scholar]
- Navarro, J. F., Frenk, C. S., & White, S. D. M. 1997, ApJ, 490, 493 [Google Scholar]
- Nipoti, C. 2015, ApJ, 805, L16 [CrossRef] [Google Scholar]
- Nipoti, C., Londrillo, P., & Ciotti, L. 2002, MNRAS, 332, 901 [CrossRef] [Google Scholar]
- Nipoti, C., Londrillo, P., & Ciotti, L. 2003, MNRAS, 342, 501 [Google Scholar]
- Nipoti, C., Londrillo, P., & Ciotti, L. 2006, MNRAS, 370, 681 [NASA ADS] [CrossRef] [Google Scholar]
- Nipoti, C., Londrillo, P., & Ciotti, L. 2007, ApJ, 660, 256 [NASA ADS] [CrossRef] [Google Scholar]
- Nipoti, C., Ciotti, L., & Londrillo, P. 2011, MNRAS, 414, 3298 [Google Scholar]
- Nipoti, C., Cherchi, G., Iorio, G., & Calura, F. 2021, MNRAS, 503, 4221 [NASA ADS] [CrossRef] [Google Scholar]
- Oh, S.-H., Hunter, D. A., Brinks, E., et al. 2015, AJ, 149, 180 [CrossRef] [Google Scholar]
- Palmer, P. L., & Papaloizou, J. 1987, MNRAS, 224, 1043 [NASA ADS] [CrossRef] [Google Scholar]
- Pascale, R., Calura, F., Lupi, A., et al. 2023, MNRAS, 526, 1428 [NASA ADS] [CrossRef] [Google Scholar]
- Pechetti, R., Seth, A., Cappellari, M., et al. 2017, ApJ, 850, 15 [NASA ADS] [CrossRef] [Google Scholar]
- Pizzella, A., Amico, P., Bertola, F., et al. 1997, A&A, 323, 349 [NASA ADS] [Google Scholar]
- Polyachenko, V. L., & Shukhman, I. G. 1981, Soviet Ast., 25, 533 [NASA ADS] [Google Scholar]
- Polyachenko, E. V., Polyachenko, V. L., & Shukhman, I. G. 2011, MNRAS, 416, 1836 [NASA ADS] [CrossRef] [Google Scholar]
- Ragone-Figueroa, C., Plionis, M., Merchán, M., Gottlöber, S., & Yepes, G. 2010, MNRAS, 407, 581 [NASA ADS] [CrossRef] [Google Scholar]
- Re, F., & Di Cintio, P. 2023, A&A, 678, A110 [NASA ADS] [CrossRef] [EDP Sciences] [Google Scholar]
- Retana-Montenegro, E., van Hese, E., Gentile, G., Baes, M., & Frutos-Alfaro, F. 2012, A&A, 540, A70 [NASA ADS] [CrossRef] [EDP Sciences] [Google Scholar]
- Rojas-Niño, A., Martínez-Medina, L. A., Pichardo, B., & Valenzuela, O. 2015, ApJ, 805, 29 [CrossRef] [Google Scholar]
- Sánchez Almeida, J. 2022, ApJ, 940, 46 [CrossRef] [Google Scholar]
- Sánchez Almeida, J., & Trujillo, I. 2021, MNRAS, 504, 2832 [CrossRef] [Google Scholar]
- Schneider, M. D., Frenk, C. S., & Cole, S. 2012, JCAP, 2012, 030 [CrossRef] [Google Scholar]
- Sérsic, J. L. 1968, Atlas de Galaxias Australes (Cordoba, Argentina: Observatorio Astronomico) [Google Scholar]
- Shu, Y., Brownstein, J. R., Bolton, A. S., et al. 2017, ApJ, 851, 48 [Google Scholar]
- Simon, J. D. 2019, ARA&A, 57, 375 [NASA ADS] [CrossRef] [Google Scholar]
- Sonnenfeld, A. 2019, https://doi.org/10.5281/zenodo.2635327 [Google Scholar]
- Sonnenfeld, A., Wang, W., & Bahcall, N. 2019, A&A, 622, A30 [NASA ADS] [CrossRef] [EDP Sciences] [Google Scholar]
- Stiavelli, M., & Sparke, L. S. 1991, ApJ, 382, 466 [NASA ADS] [CrossRef] [Google Scholar]
- Sylos Labini, F., Benhaiem, D., & Joyce, M. 2015, MNRAS, 449, 4458 [Google Scholar]
- Tinker, J. L., Brownstein, J. R., Guo, H., et al. 2017, ApJ, 839, 121 [Google Scholar]
- Tremaine, S., Richstone, D. O., Byun, Y.-I., et al. 1994, AJ, 107, 634 [CrossRef] [Google Scholar]
- Trenti, M., & Bertin, G. 2006, ApJ, 637, 717 [NASA ADS] [CrossRef] [Google Scholar]
- Trenti, M., Bertin, G., & van Albada, T. S. 2005, A&A, 433, 57 [NASA ADS] [CrossRef] [EDP Sciences] [Google Scholar]
- Valenzuela, O., Rhee, G., Klypin, A., et al. 2007, ApJ, 657, 773 [NASA ADS] [CrossRef] [Google Scholar]
- Vera-Ciro, C. A., Sales, L. V., Helmi, A., et al. 2011, MNRAS, 416, 1377 [NASA ADS] [CrossRef] [Google Scholar]
- Weinberg, M. D. 2023, MNRAS, 525, 4962 [NASA ADS] [CrossRef] [Google Scholar]
- Winters, D. M., Deur, A., & Zheng, X. 2023, MNRAS, 518, 2845 [Google Scholar]
- Worrakitpoonpon, T. 2015, MNRAS, 446, 1335 [NASA ADS] [CrossRef] [Google Scholar]
- Zahid, H. J., & Geller, M. J. 2017, ApJ, 841, 32 [NASA ADS] [CrossRef] [Google Scholar]
- Zoutendijk, S. L., Brinchmann, J., Bouché, N. F., et al. 2021, A&A, 651, A80 [NASA ADS] [CrossRef] [EDP Sciences] [Google Scholar]
All Tables
All Figures
|
Fig. 1. Mass ratio M/M* as a function of the 2D ellipticity ϵ2D measured on three random projections (indicated with increasingly large symbol size) for the end products of models with initially cold (K0 = 0) Hernquist profiles (γ = 1) with frozen (squares) and live (circles) Hernquist DM halos and in MOND (diamonds) (see rows 7, 9, and 22 in Table 1), and as a function of the deprojected ellipticity for different choices of the inclination angle θ (dots) and their average value (right panel). For comparison, in both panels the dashed line and the orange shaded area mark the Deur (2014) relation, while the vertical red dashed lines indicate the limit ellipticity 0.7. |
| In the text | |
|
Fig. 2. Sérsic index m as a function of the total to baryonic matter ratio for the end products of collapses with frozen and live DM halos, as well as dynamical to baryonic matter in MOND simulations for the simulations with parameters given in rows (7, 9, 18, 19, and 22) of Table 1. The cyan dot-dashed line marks the relation emerging from the observational data of Sonnenfeld et al. (2019). |
| In the text | |
|
Fig. 3. Intrinsic ellipticity ϵ as a function of M/M* for initially cold spherical systems in live (circles) and frozen (squares) halos (left panel); and for initially cold clumpy systems in live (downward triangles) and frozen (upward triangles) halos (right panel). The empty and filled symbols refer to ϵ evaluated inside r70% and r90%, respectively. The simulation parameters are summarised in rows (14–17) of Table 1. |
| In the text | |
|
Fig. 4. Density profiles at t = 300tDyn for halo (left panel) and baryons (right panel) for μ = 5 (squares), 2.5 (circles), 1 (diamonds), 0.167 (triangles), and 0 (downward triangles). The dashed and solid lines mark the initial profiles (γ = 1 in both cases) for DM and baryons, respectively. The simulation parameters are summarised in row (20) of Table 1. |
| In the text | |
|
Fig. 5. Same as Fig. 3 but for MOND systems with γ = 1 (left) and clumpy (right) initial conditions, corresponding to the simulation parameters summarised in rows (22 and 23) of Table 1. |
| In the text | |
|
Fig. 6. Minimum vs. maximum axial ratios for the end products of Newtonian collapses in live (circles) and frozen (squares) halos, and MOND collapses for the different values of the logarithm of the mass ratio M/M* listed in Col. 4 of Table 1 (colour bar). |
| In the text | |
|
Fig. 7. Anisotropy parameter inside r70% as a function of ϵ for the end products of the simulations. As in Fig. 6, the colour code maps the (logarithmic) mass ratio M/M* listed in Col. 4 of Table 1. |
| In the text | |
|
Fig. 8. Evolution of the anisotropy parameter ξ (top right panel) and axial ratios c/a (bottom left) and c/a (bottom right) for different Newtonian models in frozen halos (solid lines, row 7 in Table 1) and MOND models (dashed lines). |
| In the text | |
Current usage metrics show cumulative count of Article Views (full-text article views including HTML views, PDF and ePub downloads, according to the available data) and Abstracts Views on Vision4Press platform.
Data correspond to usage on the plateform after 2015. The current usage metrics is available 48-96 hours after online publication and is updated daily on week days.
Initial download of the metrics may take a while.