Fig. 4.
Download original image
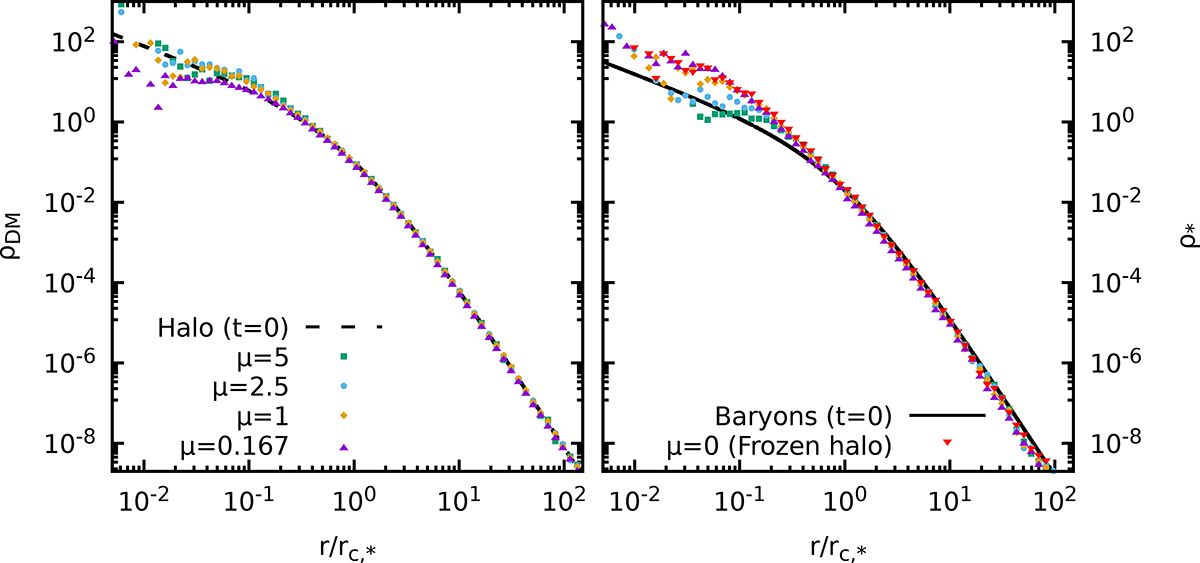
Density profiles at t = 300tDyn for halo (left panel) and baryons (right panel) for μ = 5 (squares), 2.5 (circles), 1 (diamonds), 0.167 (triangles), and 0 (downward triangles). The dashed and solid lines mark the initial profiles (γ = 1 in both cases) for DM and baryons, respectively. The simulation parameters are summarised in row (20) of Table 1.
Current usage metrics show cumulative count of Article Views (full-text article views including HTML views, PDF and ePub downloads, according to the available data) and Abstracts Views on Vision4Press platform.
Data correspond to usage on the plateform after 2015. The current usage metrics is available 48-96 hours after online publication and is updated daily on week days.
Initial download of the metrics may take a while.