Fig. 5
Download original image
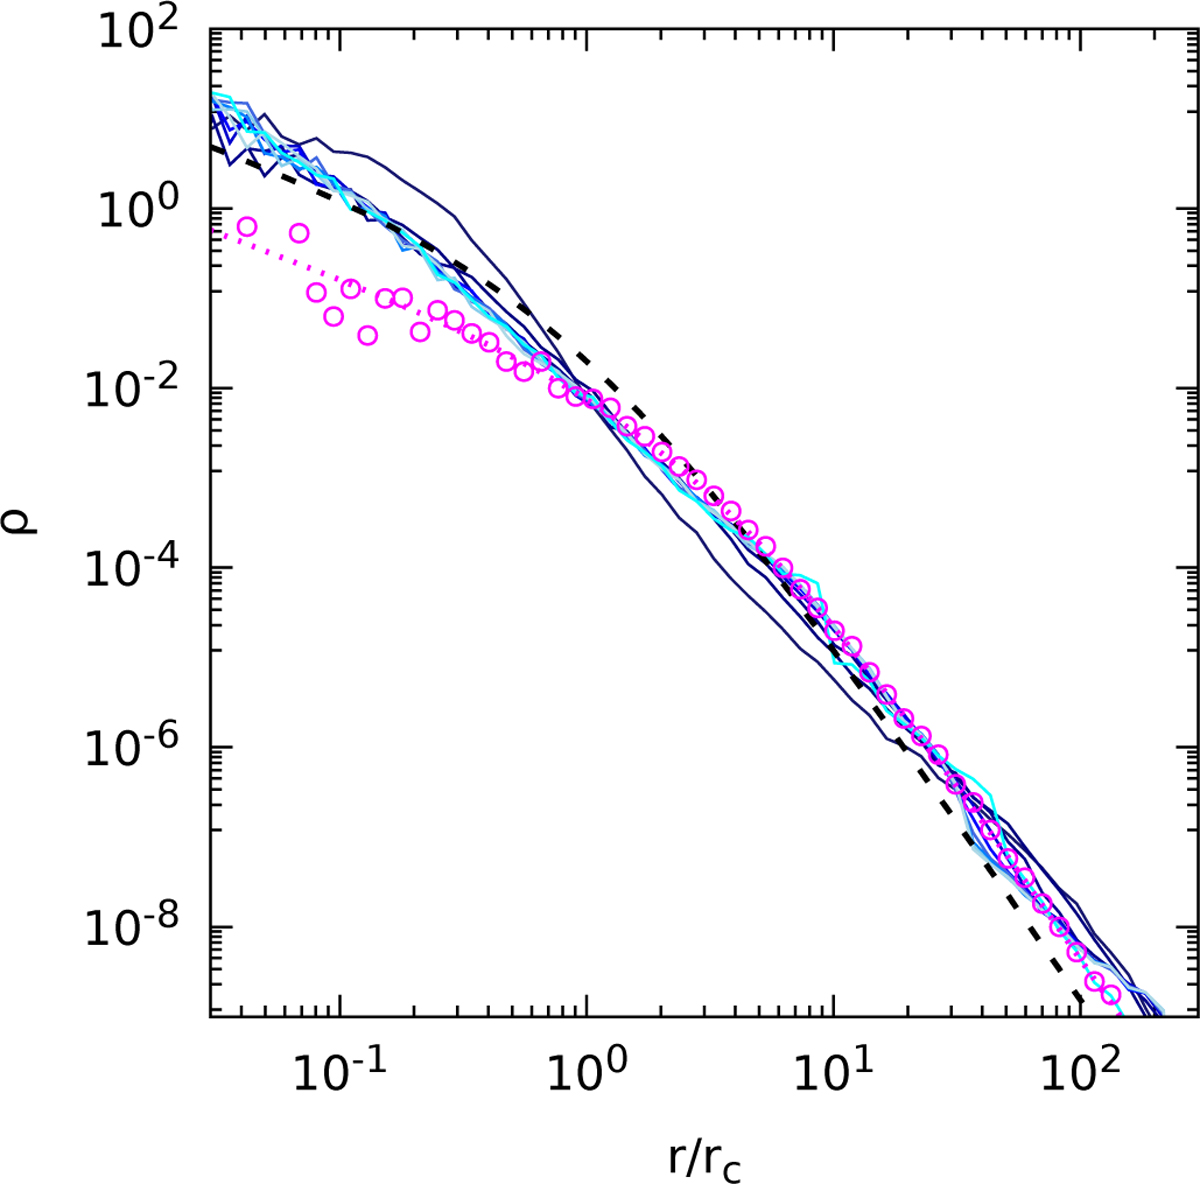
Density profile at t = 300 for the Nt = 104 tracers in models with effective N increasing from 104 to 1013, corresponding to increasingly lighter tones of blue (solid lines). Initial and final density profiles of the background model (purple and black dashed lines, respectively), and initial density profile of the tracers (points).
Current usage metrics show cumulative count of Article Views (full-text article views including HTML views, PDF and ePub downloads, according to the available data) and Abstracts Views on Vision4Press platform.
Data correspond to usage on the plateform after 2015. The current usage metrics is available 48-96 hours after online publication and is updated daily on week days.
Initial download of the metrics may take a while.