Open Access
Fig. 12
Download original image
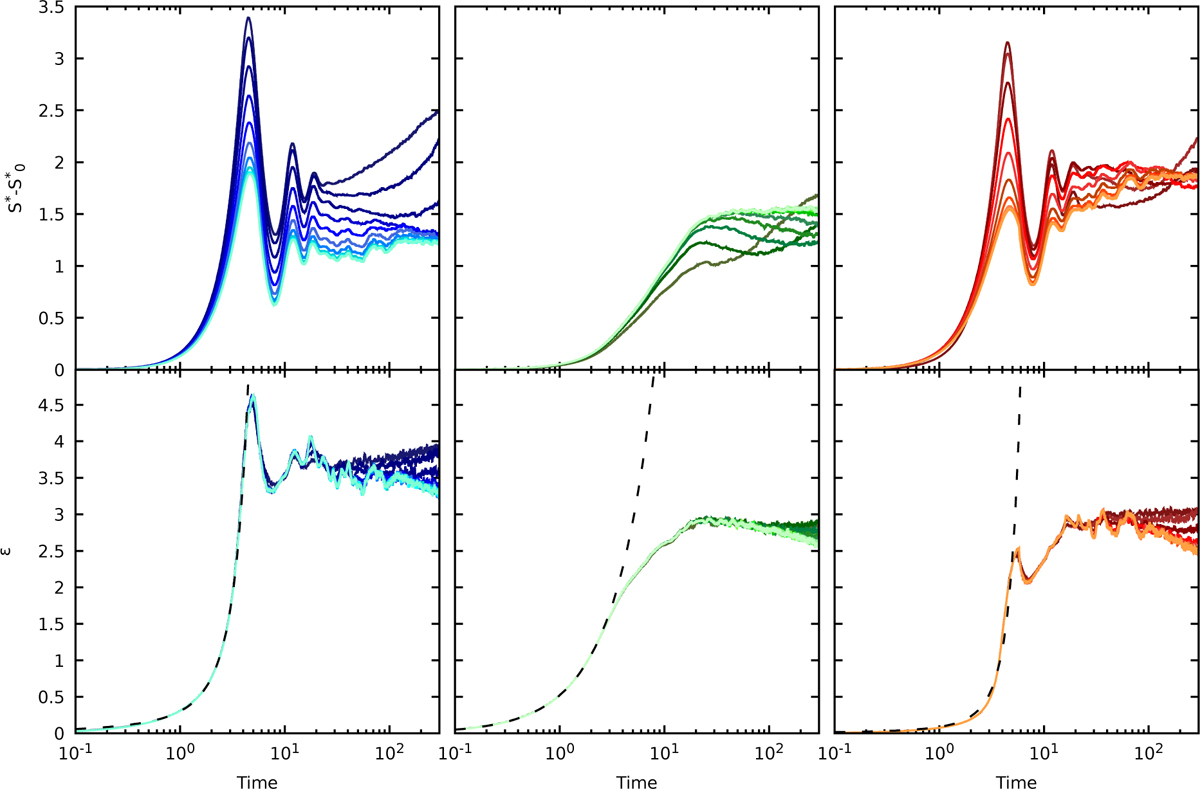
Modified HLBT entropy S * (top) and emittance ε growth (bottom) for (from left to right) self-similar collapse, cusp growth, and collapse with cusp growth. Increasingly lighter shades of blue, green, and red mark increasingly larger values of N. The dashed lines mark the best-fit growth trend of the exponential phase.
Current usage metrics show cumulative count of Article Views (full-text article views including HTML views, PDF and ePub downloads, according to the available data) and Abstracts Views on Vision4Press platform.
Data correspond to usage on the plateform after 2015. The current usage metrics is available 48-96 hours after online publication and is updated daily on week days.
Initial download of the metrics may take a while.