Fig. 11
Download original image
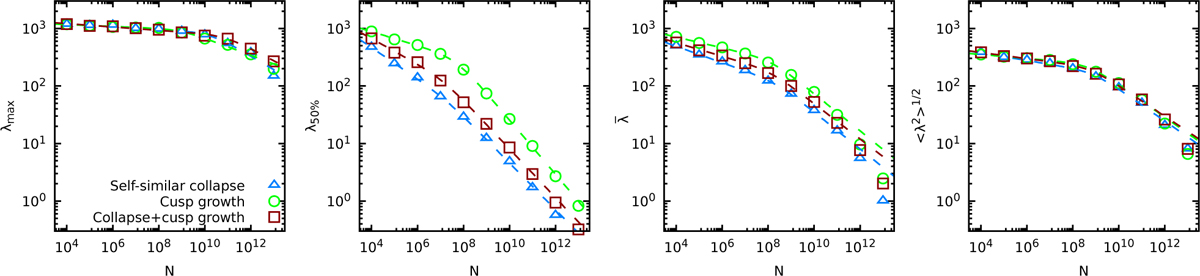
From left to right: an ensemble of tracers covering the whole accessible phase-space, N-scaling of the largest Lyapunov exponent λmax, median Lyapunov exponent λ50%, and mean value ![]() , and root mean square of the distribution ⟨λ2⟩ 1/2. The blue triangles, green circles, and red square correspond to numerical experiments simulating a self-similar collapse, a steepening of the central density cusp (γ from 0 to 1), and a collapse with cusp steepening, respectively.
, and root mean square of the distribution ⟨λ2⟩ 1/2. The blue triangles, green circles, and red square correspond to numerical experiments simulating a self-similar collapse, a steepening of the central density cusp (γ from 0 to 1), and a collapse with cusp steepening, respectively.
Current usage metrics show cumulative count of Article Views (full-text article views including HTML views, PDF and ePub downloads, according to the available data) and Abstracts Views on Vision4Press platform.
Data correspond to usage on the plateform after 2015. The current usage metrics is available 48-96 hours after online publication and is updated daily on week days.
Initial download of the metrics may take a while.