| Issue |
A&A
Volume 698, June 2025
|
|
|---|---|---|
| Article Number | L23 | |
| Number of page(s) | 5 | |
| Section | Letters to the Editor | |
| DOI | https://doi.org/10.1051/0004-6361/202554730 | |
| Published online | 20 June 2025 | |
Letter to the Editor
Magnetic braking and dynamo evolution of β Hydri
1
Instituto de Astrofísica e Ciências do Espaço, Universidade do Porto, CAUP, Rua das Estrelas, PT4150-762 Porto, Portugal
2
Departamento de Física e Astronomia, Faculdade de Ciências, Universidade do Porto, Rua do Campo Alegre 687, PT4169-007 Porto, Portugal
3
Center for Solar-Stellar Connections, White Dwarf Research Corporation, 9020 Brumm Trail, Golden, CO 80403, USA
4
Department of Physics and Astronomy, Uppsala University, Box 516 SE-75120 Uppsala, Sweden
5
Center for Astrophysics and Space Astronomy, 389 UCB, University of Colorado, Boulder CO 80309, USA
6
Geophysical and Astronomical Observatory, Faculty of Science and Technology, University of Coimbra, Rua do Observatório s/n, PT3040-004 Coimbra, Portugal
7
Instituto de Astrofísica e Ciências do Espaço, Department of Physics, University of Coimbra, Rua Larga, PT3040-004 Coimbra, Portugal
⋆ Corresponding author: This email address is being protected from spambots. You need JavaScript enabled to view it.
Received:
24
March
2025
Accepted:
9
May
2025
Abstract
The evolution of magnetic braking and dynamo processes in subgiant stars is essential for understanding how these stars lose angular momentum. In this work, we investigate the magnetic braking and dynamo evolution of the G-type subgiant β Hyi to test the hypothesis of weakened magnetic braking and the potential rejuvenation of large-scale magnetic fields. We analyzed spectropolarimetric observations from the polarimetric mode of High Accuracy Radial velocity Planet Searcher (HARPSpol) and combined them with archival X-ray data and asteroseismic properties from Transiting Exoplanet Survey Satellite (TESS) to estimate the current wind-braking torque of β Hyi. Despite experiencing weakened magnetic braking during the second half of its main-sequence lifetime, our results indicate that β Hyi has regained significant magnetic activity and a large-scale magnetic field. This observation aligns with the “born-again” dynamo hypothesis. Furthermore, our estimated wind braking torque is considerably stronger than what would be expected for a star in the weakened magnetic braking regime. This suggests that subgiants with extended convective zones can temporarily re-establish large-scale dynamo action. These results provide critical constraints on stellar rotation models and improve our understanding of the interplay between magnetic field structure, stellar activity cycles, and angular momentum evolution in old solar-type stars.
Key words: techniques: polarimetric / stars: evolution / stars: magnetic field / stars: individual: HD 2151 / stars: winds / outflows
© The Authors 2025
 Open Access article, published by EDP Sciences, under the terms of the Creative Commons Attribution License (https://creativecommons.org/licenses/by/4.0), which permits unrestricted use, distribution, and reproduction in any medium, provided the original work is properly cited.
This article is published in open access under the Subscribe to Open model. This email address is being protected from spambots. You need JavaScript enabled to view it. to support open access publication.
1. Introduction
Some of the most stringent tests of weakened magnetic braking (WMB; van Saders et al. 2016) in old solar-type stars can be performed on subgiants. During the early phases of stellar evolution, rotation slows as the magnetized stellar wind gradually sheds angular momentum in a process known as magnetic braking (Weber & Davis 1967; Skumanich 1972; Kawaler 1988). According to the WMB hypothesis, when rotation becomes sufficiently slow, the stellar dynamo can no longer organize magnetic fields on the largest spatial scales, thereby inhibiting further angular momentum loss (Réville et al. 2015; Garraffo et al. 2016) and keeping the rotation rate approximately constant during the second half of the main sequence lifetime. The rotation periods predicted by WMB and standard rotational evolution models subsequently diverge, reaching a maximum fractional difference on the subgiant branch (van Saders et al. 2019). Observations of the G8 subgiant 94 Aqr Aa provided an early test of WMB, which successfully explained a rotation period about half as long as that predicted by standard models (Metcalfe et al. 2020).
If the onset of WMB corresponds to a transition in the underlying dynamo, then there should be observable signatures in the evolution of stellar activity cycles. This idea was first proposed by Metcalfe & van Saders (2017), who suggested a gradual lengthening and weakening of activity cycles during the second half of main-sequence lifetimes, ultimately leading to the “flat activity” stars in the Mount Wilson survey (Wilson 1978; Baliunas et al. 1995). With few exceptions, most of the subgiants with long-term stellar activity measurements show flat activity. The exceptions are either stars that originated above the Kraft (1967) break and only developed a substantial convection zone as a subgiant (e.g., HD 81809; Egeland 2018), or stars slightly more massive than the Sun that rejuvenated their activity cycles with a growing convection zone on the subgiant branch; namely, the “born-again” dynamo scenario described by Metcalfe et al. (2020, 2024a). Both 94 Aqr Aa and β Hyi are in this latter category of exceptions, which is only possible with WMB (see Metcalfe et al. 2024a, their Fig. 5).
A key question is whether the born-again dynamo phase is accompanied by the return of the large-scale magnetic field and the ensuing higher rate of angular momentum loss. To address this question, we estimated the current wind braking torque of β Hyi following the prescription of Finley & Matt (2018). In Section 2, we assemble the required inputs, including: spectropolarimetry to constrain the large-scale magnetic field strength, X-ray measurements to constrain the mass-loss rate from the empirical relation of Wood et al. (2021), the rotation period from the Transiting Exoplanet Survey Satellite (TESS; Ricker et al. 2014), and the asteroseismic stellar mass and radius (Metcalfe et al. 2024a). In Section 3, we use these inputs to estimate the wind braking torque and we evaluate the results in the context of similar observations of several solar analogs and slightly hotter stars. Finally, in Section 4, we discuss our results, concluding that the onset of WMB may coincide with a threshold for the decay of large-scale dynamo action, which can be temporarily reversed in the born-again phase.
2. β Hyi observations and properties
2.1. Spectropolarimetry and large-scale field
We observed β Hyi on July 14, 2024 with the High Accuracy Radial velocity Planet Searcher (HARPS; Mayor et al. 2003), using the polarimetric mode (HARPSpol; Piskunov et al. 2011; Snik et al. 2011). This instrument configuration allowed us to obtain intensity (Stokes I) and circular polarization (Stokes V) spectra simultaneously, with a resolving power of 110 000 and a wavelength coverage from 379 to 691 nm, except for a gap in the 526−534 nm region. The target was observed for ∼5 h, yielding 49 independent observations. Each observation consisted of four 30 s sub-exposures, between which the quarter-wave plate in the HARPSpol polarimeter was rotated to exchange positions of the orthogonally polarized beams on the detector. This procedure followed the standard spatio-temporal spectropolarimetric modulation scheme widely used in high-resolution polarimetry (Donati et al. 1997; Bagnulo et al. 2009). The spectra were reduced using the REDUCE package (Piskunov & Valenti 2002), following the procedure described in Rusomarov et al. (2013). The resulting data are characterized by a signal-to-noise ratio of ∼200 per pixel at λ = 550 nm.
As is typical for most cool stars, observational noise precludes the detection of polarization signatures in individual spectral lines of β Hyi. To overcome this, we calculated least-squares deconvolved (LSD; Donati et al. 1997; Kochukhov et al. 2010) Stokes I and V profiles by combining numerous spectral lines. The LSD line mask was obtained from the VALD database (Ryabchikova et al. 2015), using Teff = 5750 K and log g = 4.0, close to the literature values of atmospheric parameters of β Hyi. Retaining spectral lines with the central depth exceeding 10% of the continuum and excluding regions affected by broad stellar lines and telluric features resulted in about 4800 metal lines suitable for LSD. The line-addition procedure was applied to the 49 observations individually and then the resulting profiles were combined, achieving a polarimetric sensitivity of ≈8 × 10⁻⁶ per 0.8 km s−1 velocity bin in Stokes V. The mean circular polarization profile of β Hyi, illustrated in Fig. 1, shows a clear detection of a Zeeman signature. The false alarm probability of this detection is < 10−6 indicating a definite detection according to the conventions in high-resolution spectropolarimetry (Donati et al. 1997). This Stokes V profile corresponds to a mean longitudinal magnetic field of ⟨Bz⟩= − 0.298 ± 0.086 G.
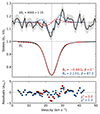 |
Fig. 1. LSD Stokes V and I profiles for β Hyi derived from HARPSpol observations (top). For illustration purposes, Stokes V is scaled and shifted vertically in relation to Stokes I. The black solid line shows the mean observed profile, with the respective uncertainty indicated by the gray-shaded region. The vertical dotted line marks the line center. The red and blue lines indicate the best-fit models obtained for a dipole field, considering an axisymmetric and an inclined field, respectively. The red squares and blue circles show the corresponding residuals for the Stokes V profile (bottom). The fitting parameters and χ2 values are annotated within the panels. |
To characterize the global magnetic field of β Hyi, we fit the observed LSD Stokes V profile with the modeling procedure from Metcalfe et al. (2019). This modeling approach, based on the assumption of an axisymmetric dipolar field morphology, requires adopting a stellar inclination angle, i. We followed the procedure by Bowler et al. (2023) to constrain the i posterior distribution, knowing the projected rotational velocity, rotation period, and stellar radius. We found  . The best fit to the polarization profile, assuming an axisymmetric dipole (in red), returned a polar magnetic field strength of Bd = −0.64 G. However, as seen in Fig. 1, the fit to the data is relatively poor with a reduced χ2 of 3.0. The likely cause for this discrepancy is the presence of dominant non-axisymmetric field components at the time of our observation of β Hyi. To account for this more complex global field geometry, we made use of the INVERSLSD code (Kochukhov et al. 2014), running it in a highly restrictive mode with only dipolar poloidal components allowed in the harmonic expansion (ℓmax = 1, β = α, and γ = 0 according to the harmonic coefficient definitions in Kochukhov et al. 2014). This approach leads to an improvement of the fit, with χ2 = 1.3. In this case, the best-fit parameters correspond to a dipolar field strength of Bd = 2.13 G and an obliquity angle of β = 87.3°.
2.2. X-ray data and mass-loss rate
β Hyi is an active subgiant star known to harbor a magnetic activity cycle (Dravins et al. 1993; Metcalfe et al. 2007). The cycle period (Pcyc) is estimated to be approximately 12 yr, based on the Mg II activity proxy (Metcalfe et al. 2007) with data from the International Ultraviolet Explorer (IUE; Boggess et al. 1978a,b). Dravins et al. (1993) found β Hyi to have a lower mean activity level than the Sun. However, compared to the weaker Solar Cycle 24 discussed below, β Hyi has a higher mean activity level.
Figure 2 shows the X-ray luminosity of β Hyi (circles), relative to its bolometric luminosity LBOL. The gray line depicts the 2008−2019 X-ray modulation of Solar Cycle 24 (Ayres 2021), as derived by smoothing the daily values in the 0.1−2.4 keV bandpass with an 81-day running mean (three solar synodic rotations). The single-cycle template was then replicated over several 11-year intervals, and scaled in period (using Pcyc = 12 yr) and amplitude to match the X-ray variability of β Hyi seen during the ROSAT (Röntegen Satellit; Trümper 1982) era of 1990−1998. The latter was based on archival X-ray count rates from multiple sources: ROSAT All Sky Survey (yellow), ROSAT Position Sensitive Proportional Counters catalog (orange), and ROSAT High Resolution Imager catalog (red). For comparison, the white squares show the IUE Mg II fluxes (Metcalfe et al. 2007) shifted in the mean and stretched in amplitude to match the apparent X-ray high and low values. The blue and green circles show the recent X-ray luminosities from XMM-Newton EPIC (X-ray Multi-Mirror; The European Photon Imaging Camera; Jansen et al. 2001), and Chandra ACIS (Advanced CCD (Charge-Couple Device) Imaging Spectrometer; Weisskopf et al. 2000, 2002), both being custom-processed (details in Ayres 2025). In all cases, the X-ray count rates were converted to fluxes using model-derived energy conversion factors (Ayres 2025), which also depend on the instrument response function.
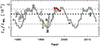 |
Fig. 2. X-ray to bolometric luminosity ratio of β Hyi (circles). The light gray curve mimics the solar X-ray variation over Cycle 24, replicated in time and stretched to a period of 12 yr, then adjusted to the apparent X-ray modulation amplitude of β Hyi. Archival ROSAT fluxes from various catalogs are shown as the yellow, orange, and red circles, XMM-Newton as the blue circle, and Chandra as the green open circle. Horizontal dashed and dot-dashed lines mark the mean normalized X-ray luminosity of β Hyi and ±1σ uncertainties. White squares represent the Mg II time-series scaled to match the amplitude of the X-ray variation. |
The combined data reproduce the peaks and valleys of the X-ray variability of β Hyi tolerably well, supporting the 12 yr cycle period originally derived solely from Mg II (Metcalfe et al. 2007). The corresponding mean X-ray luminosity is ⟨LX⟩ = 5.1 ± 3.1 × 1027 erg s−1. The uncertainty, taken as the standard deviation of the X-ray measurements, is a good proxy for the amplitude of the high-energy variation over the activity cycle. To estimate the mass-loss rate Ṁ of β Hyi, we used the empirical relation  from Wood et al. (2021), where FX is the X-ray surface flux, computed from ⟨LX⟩ and the asteroseismic radius. Finally, we obtained a current mass-loss rate of
  .
.
3. Wind braking torque
At this point, we have everything required to estimate the wind braking torque for β Hyi, following the prescription of Finley & Matt (2018)1. Combining the large-scale magnetic field strength from spectropolarimetry (described in Section 2.1), the mass-loss rate from the empirical relation of Wood et al. (2021) in Section 2.2, and the rotation period as well as the asteroseismic mass and radius from TESS photometry (Metcalfe et al. 2024a), we calculated a wind braking torque of  erg (see Table 1). The uncertainties have been defined by simultaneously shifting all of the inputs to their ±1σ values to minimize or maximize the torque.
Properties of the solar-type subgiant β Hyi.
In Fig. 3, we compare β Hyi with similarly estimated wind braking torques for two late F-type stars (Metcalfe et al. 2021), and five solar analogs (Metcalfe et al. 2022, 2024b). The Rossby numbers (Ro ≡ Prot/τc) were calculated using the observed rotation periods and the asteroseismic calibration of convective turnover time from Corsaro et al. (2021), normalized to the solar value on this scale (Ro⊙ = 0.496). The wind braking torque is normalized to the value for HD 76151 (4.17 × 1030 erg) to facilitate a comparison with theoretical models. The gray shaded area represents an empirical constraint on the critical Rossby number for the onset of WMB (Rocrit/Ro⊙ = 0.92 ± 0.01; Metcalfe et al. 2024b) and the dotted yellow line shows the evolution of the torque for HD 76151 from a standard spin-down model (van Saders & Pinsonneault 2013). For β Hyi, the horizontal error bar is dominated by the rotation period uncertainty, while the vertical error bar is dominated by variation of the X-ray surface flux through the activity cycle.
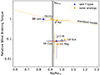 |
Fig. 3. Estimated wind braking torque relative to HD 76151 as a function of Rossby number normalized to the solar value. Points are grouped by spectral type, as indicated in the legend. The gray shaded area represents an empirical constraint on the critical Rossby number for the onset of WMB (Rocrit/Ro⊙ = 0.92 ± 0.01; Metcalfe et al. 2024b). The solar wind braking torque was taken from Finley et al. (2018). |
The Rossby number of β Hyi places it between Rocrit and the solar value (cf. Metcalfe et al. 2024a, their Fig. 5), where the wind braking torque decreases abruptly by an order of magnitude in middle-aged dwarfs. Compared to other solar analogs in the WMB regime such as 16 Cyg A, the wind braking torque for β Hyi is nearly an order of magnitude stronger. To assess the underlying sources of this stronger torque, we can change one parameter at a time between the fiducial models for β Hyi and 16 Cyg A (Metcalfe et al. 2022). Small decreases in torque would be expected from the longer rotation period (−11%), the lower estimated mass-loss rate (−7%), and the slightly higher stellar mass (−1.1%) of β Hyi. However, these differences are overwhelmed by the increase in torque from the much stronger magnetic field (+280%) and the larger stellar radius (+260%). Together, these parameters increase the surface magnetic flux and yield a larger Alfvén radius (lever-arm) for a given mass-loss rate in the simulations of Finley & Matt (2018).
4. Discussion and conclusions
The evolution of stellar magnetism is closely linked to changes in the rotation and convective properties of stars. During the main sequence, the Ro evolution is dictated by the Prot evolution, which generally increases with age. In the WMB scenario, stars gradually lose their magnetic cycles, while the Prot evolution due to magnetic braking almost ceases. In the subgiant phase, as the star expands, the convective turnover time grows longer, dominating over the Prot evolution and contributing to a decreasing Ro. This can eventually bring Ro back below Rocrit. As a result, the large-scale dynamo can be rejuvenated in the subgiant phase, allowing stars to sustain activity cycles once more–a phenomenon known as the born-again dynamo (Metcalfe et al. 2020, 2024a). Therefore, subgiant stars are valuable for testing stellar evolution scenarios, particularly those related to stellar magnetism. Our analysis is focused on the subgiant β Hyi, which harbors a magnetic activity cycle more typical of a younger solar-like dynamo, contrary to expectations and supporting the born-again dynamo scenario. Combining HARPSpol magnetic field constraints, the X-ray surface flux, and other stellar properties such as the rotation period, mass, and radius, we estimated the current mass-loss rate and wind braking torque of β Hyi. The latter exceeds that of the Sun by nearly an order of magnitude, suggesting the return of a stronger large-scale field coinciding with the born-again dynamo phase. Despite the current wind braking torque of β Hyi, Metcalfe et al. (2024a) demonstrated that standard spin-down models cannot match its observed rotation period, and Ro never returns below Rocrit in the subsequent evolution. By contrast, WMB models do match the observed rotation period and also bring Ro close to Rocrit at its current asteroseismic age. In other words, β Hyi appears to have experienced WMB near the middle of its main-sequence lifetime, after reaching Rocrit earlier in its evolution.
If the value of Rocrit for the onset of WMB is also the critical value for the efficient organization of large-scale fields, then the activity cycle in β Hyi may represent a subcritical dynamo (Tripathi et al. 2021). Durney & Latour (1978) suggested that the dynamo number D ∝ Ro−2 and low values of D are insufficient to organize large-scale fields until reaching a critical value Dcrit. However, due to hysteresis in the system, models that are initialized with magnetism can continue to organize large-scale field even when D < Dcrit, resulting in a “subcritical dynamo” (Vashishth et al. 2021). This mirrors stellar evolution, where stars begin with higher magnetic activity levels and low Ro, gradually becoming less active over time while Ro increases. This leads to the possibility that Rocrit may correspond to Dcrit, and dynamos that operate with Ro > Rocrit are subcritical. The rejuvenation of large-scale field and magnetic braking in β Hyi above Rocrit supports the idea that its activity cycle may be driven by a subcritical dynamo. However, the rotation period uncertainty does not currently exclude the possibility that Ro < Rocrit.
Future observations of β Hyi may refine our estimate of the wind braking torque. We used a single spectropolarimetric measurement to constrain the large-scale magnetic field by modeling the Stokes V profile with an inclined dipole. Observations spanning a complete rotation would allow for Zeeman-Doppler imaging (ZDI), thereby providing the detailed morphology of the magnetic field, which may be more complex. We estimated the mass-loss rate from the X-ray surface flux using the empirical relation of Wood et al. (2021). However, direct inferences of the mass-loss rate from Lyα observations can deviate substantially from this relation, particularly for subgiants (e.g., δ Pav and δ Eri). Lyα measurements of β Hyi from the Hubble Space Telescope are currently scheduled for April 2025 (HST-GO-17793, PI: B. Wood), so a direct inference of the mass-loss rate may soon be possible. The measured rotation period still has a large uncertainty, but the TESS mission will observe β Hyi again for two consecutive sectors (54 days) in July through August 2025, providing an opportunity to confirm or refine the current measurement. These new constraints on the wind braking torque should help clarify whether the activity cycle in β Hyi truly represents a subcritical dynamo or whether long-term UV/X-ray measurements of other stars with apparently constant activity in Ca HK (e.g., ρ CrB and 16 Cyg A & B) might also reveal cycling behavior. As one of only two low-mass subgiants currently known to exhibit an activity cycle, β Hyi is a crucial benchmark for testing and refining models of magnetic braking and dynamo evolution in old solar-type stars.
Acknowledgments
This work is based on observations collected at the European Organisation for Astronomical Research in the Southern Hemisphere under ESO programme 113.26SZ.001. It was supported by Fundação para a Ciência e a Tecnologia (FCT) through the research grants UIDB/04434/2020 (DOI: 10.54499/UIDB/04434/2020), UIDP/04434/2020.FCT (DOI: 10.54499/UIDP/04434/2020) and 2022.03993.PTDC (DOI: 10.54499/2022.03993.PTDC). This research was also supported by the International Space Science Institute (ISSI) in Bern, through ISSI International Team project 24-629 (Multi-scale variability in solar and stellar magnetic cycles). A.R.G.S. acknowledges the support from the FCT through the work contract No. 2020.02480.CEECIND/CP1631/CT0001 (DOI: 10.54499/2020.02480.CEECIND/CP1631/CT0001). T.S.M. acknowledges support from NSF grant AST-2205919 and NASA grant 80NSSC22K0475. O.K. acknowledges support by the Swedish Research Council (grant agreement no. 2023-03667) and the Swedish National Space Agency. T.L.C. is supported by FCT in the form of a work contract (2023.08117.CEECIND/CP2839/CT0004; DOI: 10.54499/2023.08117.CEECIND/CP2839/CT0004).
References
- Ayres, T. R. 2021, ApJ, 923, 192 [Google Scholar]
- Ayres, T. 2025, AJ, 169, 281 [Google Scholar]
- Bagnulo, S., Landolfi, M., Landstreet, J. D., et al. 2009, PASP, 121, 993 [Google Scholar]
- Baliunas, S. L., Donahue, R. A., Soon, W. H., et al. 1995, ApJ, 438, 269 [Google Scholar]
- Boggess, A., Carr, F. A., Evans, D. C., et al. 1978a, Nature, 275, 372 [NASA ADS] [CrossRef] [Google Scholar]
- Boggess, A., Bohlin, R. C., Evans, D. C., et al. 1978b, Nature, 275, 377 [NASA ADS] [CrossRef] [Google Scholar]
- Bowler, B. P., Tran, Q. H., Zhang, Z., et al. 2023, AJ, 165, 164 [NASA ADS] [CrossRef] [Google Scholar]
- Bruntt, H., Bedding, T. R., Quirion, P. O., et al. 2010, MNRAS, 405, 1907 [Google Scholar]
- Corsaro, E., Bonanno, A., Mathur, S., et al. 2021, A&A, 652, L2 [NASA ADS] [CrossRef] [EDP Sciences] [Google Scholar]
- Donati, J. F., Semel, M., Carter, B. D., Rees, D. E., & Collier Cameron, A. 1997, MNRAS, 291, 658 [Google Scholar]
- Dravins, D., Linde, P., Ayres, T. R., et al. 1993, ApJ, 403, 412 [Google Scholar]
- Durney, B. R., & Latour, J. 1978, Geophys. Astrophys. Fluid Dyn., 9, 241 [Google Scholar]
- Egeland, R. 2018, ApJ, 866, 80 [Google Scholar]
- Finley, A. J., & Matt, S. P. 2018, ApJ, 854, 78 [Google Scholar]
- Finley, A. J., Matt, S. P., & See, V. 2018, ApJ, 864, 125 [NASA ADS] [CrossRef] [Google Scholar]
- Garraffo, C., Drake, J. J., & Cohen, O. 2016, A&A, 595, A110 [NASA ADS] [CrossRef] [EDP Sciences] [Google Scholar]
- Henry, T. J., Soderblom, D. R., Donahue, R. A., & Baliunas, S. L. 1996, AJ, 111, 439 [Google Scholar]
- Jansen, F., Lumb, D., Altieri, B., et al. 2001, A&A, 365, L1 [NASA ADS] [CrossRef] [EDP Sciences] [Google Scholar]
- Kawaler, S. D. 1988, ApJ, 333, 236 [Google Scholar]
- Kochukhov, O., Makaganiuk, V., & Piskunov, N. 2010, A&A, 524, A5 [NASA ADS] [CrossRef] [EDP Sciences] [Google Scholar]
- Kraft, R. P. 1967, ApJ, 150, 551 [Google Scholar]
- Mayor, M., Pepe, F., Queloz, D., et al. 2003, The Messenger, 114, 20 [NASA ADS] [Google Scholar]
- Metcalfe, T. S., & van Saders, J. 2017, Sol. Phys., 292, 126 [NASA ADS] [CrossRef] [Google Scholar]
- Metcalfe, T. S., Dziembowski, W. A., Judge, P. G., & Snow, M. 2007, MNRAS, 379, L16 [NASA ADS] [CrossRef] [Google Scholar]
- Metcalfe, T. S., Kochukhov, O., Ilyin, I. V., et al. 2019, ApJ, 887, L38 [NASA ADS] [CrossRef] [Google Scholar]
- Metcalfe, T. S., van Saders, J. L., Basu, S., et al. 2020, ApJ, 900, 154 [Google Scholar]
- Metcalfe, T. S., van Saders, J. L., Basu, S., et al. 2021, ApJ, 921, 122 [NASA ADS] [CrossRef] [Google Scholar]
- Metcalfe, T. S., Finley, A. J., Kochukhov, O., et al. 2022, ApJ, 933, L17 [NASA ADS] [CrossRef] [Google Scholar]
- Metcalfe, T. S., van Saders, J. L., Huber, D., et al. 2024a, ApJ, 974, 31 [Google Scholar]
- Metcalfe, T. S., Strassmeier, K. G., Ilyin, I. V., et al. 2024b, ApJ, 960, L6 [NASA ADS] [CrossRef] [Google Scholar]
- Kochukhov, O., Lüftinger, T., Neiner, C., Alecian, E., & MiMeS Collaboration 2014, A&A, 565, A83 [NASA ADS] [CrossRef] [EDP Sciences] [Google Scholar]
- North, J. R., Davis, J., Bedding, T. R., et al. 2007, MNRAS, 380, L80 [Google Scholar]
- Piskunov, N. E., & Valenti, J. A. 2002, A&A, 385, 1095 [NASA ADS] [CrossRef] [EDP Sciences] [Google Scholar]
- Piskunov, N., Snik, F., Dolgopolov, A., et al. 2011, The Messenger, 143, 7 [NASA ADS] [Google Scholar]
- Réville, V., Brun, A. S., Matt, S. P., Strugarek, A., & Pinto, R. F. 2015, ApJ, 798, 116 [Google Scholar]
- Ricker, G. R., Winn, J. N., Vanderspek, R., et al. 2014, Proc. SPIE, 9143, 914320 [Google Scholar]
- Rusomarov, N., Kochukhov, O., Piskunov, N., et al. 2013, A&A, 558, A8 [NASA ADS] [CrossRef] [EDP Sciences] [Google Scholar]
- Ryabchikova, T., Piskunov, N., Kurucz, R. L., et al. 2015, Phys. Scr., 90, 054005 [Google Scholar]
- Skumanich, A. 1972, ApJ, 171, 565 [Google Scholar]
- Snik, F., Kochukhov, O., Piskunov, N., et al. 2011, ASP Conf. Ser., 437, 237 [Google Scholar]
- Tripathi, B., Nandy, D., & Banerjee, S. 2021, MNRAS, 506, L50 [Google Scholar]
- Trümper, J. 1982, Adv. Space Res., 2, 241 [Google Scholar]
- van Saders, J. L., & Pinsonneault, M. H. 2013, ApJ, 776, 67 [Google Scholar]
- van Saders, J. L., Ceillier, T., Metcalfe, T. S., et al. 2016, Nature, 529, 181 [Google Scholar]
- van Saders, J. L., Pinsonneault, M. H., & Barbieri, M. 2019, ApJ, 872, 128 [NASA ADS] [CrossRef] [Google Scholar]
- Vashishth, V., Karak, B. B., & Kitchatinov, L. 2021, RAA, 21, 266 [Google Scholar]
- Weber, E. J., & Davis, L. 1967, ApJ, 148, 217 [Google Scholar]
- Weisskopf, M. C., Tananbaum, H. D., Van Speybroeck, L. P., & O’Dell, S. L. 2000, Proc. SPIE, 4012, 2 [Google Scholar]
- Weisskopf, M. C., Brinkman, B., Canizares, C., et al. 2002, PASP, 114, 1 [NASA ADS] [CrossRef] [Google Scholar]
- Wilson, O. C. 1978, ApJ, 226, 379 [Google Scholar]
- Wood, B. E., Müller, H.-R., Redfield, S., et al. 2021, ApJ, 915, 37 [NASA ADS] [CrossRef] [Google Scholar]
All Tables
All Figures
|
Fig. 1. LSD Stokes V and I profiles for β Hyi derived from HARPSpol observations (top). For illustration purposes, Stokes V is scaled and shifted vertically in relation to Stokes I. The black solid line shows the mean observed profile, with the respective uncertainty indicated by the gray-shaded region. The vertical dotted line marks the line center. The red and blue lines indicate the best-fit models obtained for a dipole field, considering an axisymmetric and an inclined field, respectively. The red squares and blue circles show the corresponding residuals for the Stokes V profile (bottom). The fitting parameters and χ2 values are annotated within the panels. |
| In the text | |
|
Fig. 2. X-ray to bolometric luminosity ratio of β Hyi (circles). The light gray curve mimics the solar X-ray variation over Cycle 24, replicated in time and stretched to a period of 12 yr, then adjusted to the apparent X-ray modulation amplitude of β Hyi. Archival ROSAT fluxes from various catalogs are shown as the yellow, orange, and red circles, XMM-Newton as the blue circle, and Chandra as the green open circle. Horizontal dashed and dot-dashed lines mark the mean normalized X-ray luminosity of β Hyi and ±1σ uncertainties. White squares represent the Mg II time-series scaled to match the amplitude of the X-ray variation. |
| In the text | |
|
Fig. 3. Estimated wind braking torque relative to HD 76151 as a function of Rossby number normalized to the solar value. Points are grouped by spectral type, as indicated in the legend. The gray shaded area represents an empirical constraint on the critical Rossby number for the onset of WMB (Rocrit/Ro⊙ = 0.92 ± 0.01; Metcalfe et al. 2024b). The solar wind braking torque was taken from Finley et al. (2018). |
| In the text | |
Current usage metrics show cumulative count of Article Views (full-text article views including HTML views, PDF and ePub downloads, according to the available data) and Abstracts Views on Vision4Press platform.
Data correspond to usage on the plateform after 2015. The current usage metrics is available 48-96 hours after online publication and is updated daily on week days.
Initial download of the metrics may take a while.