Fig. 1.
Download original image
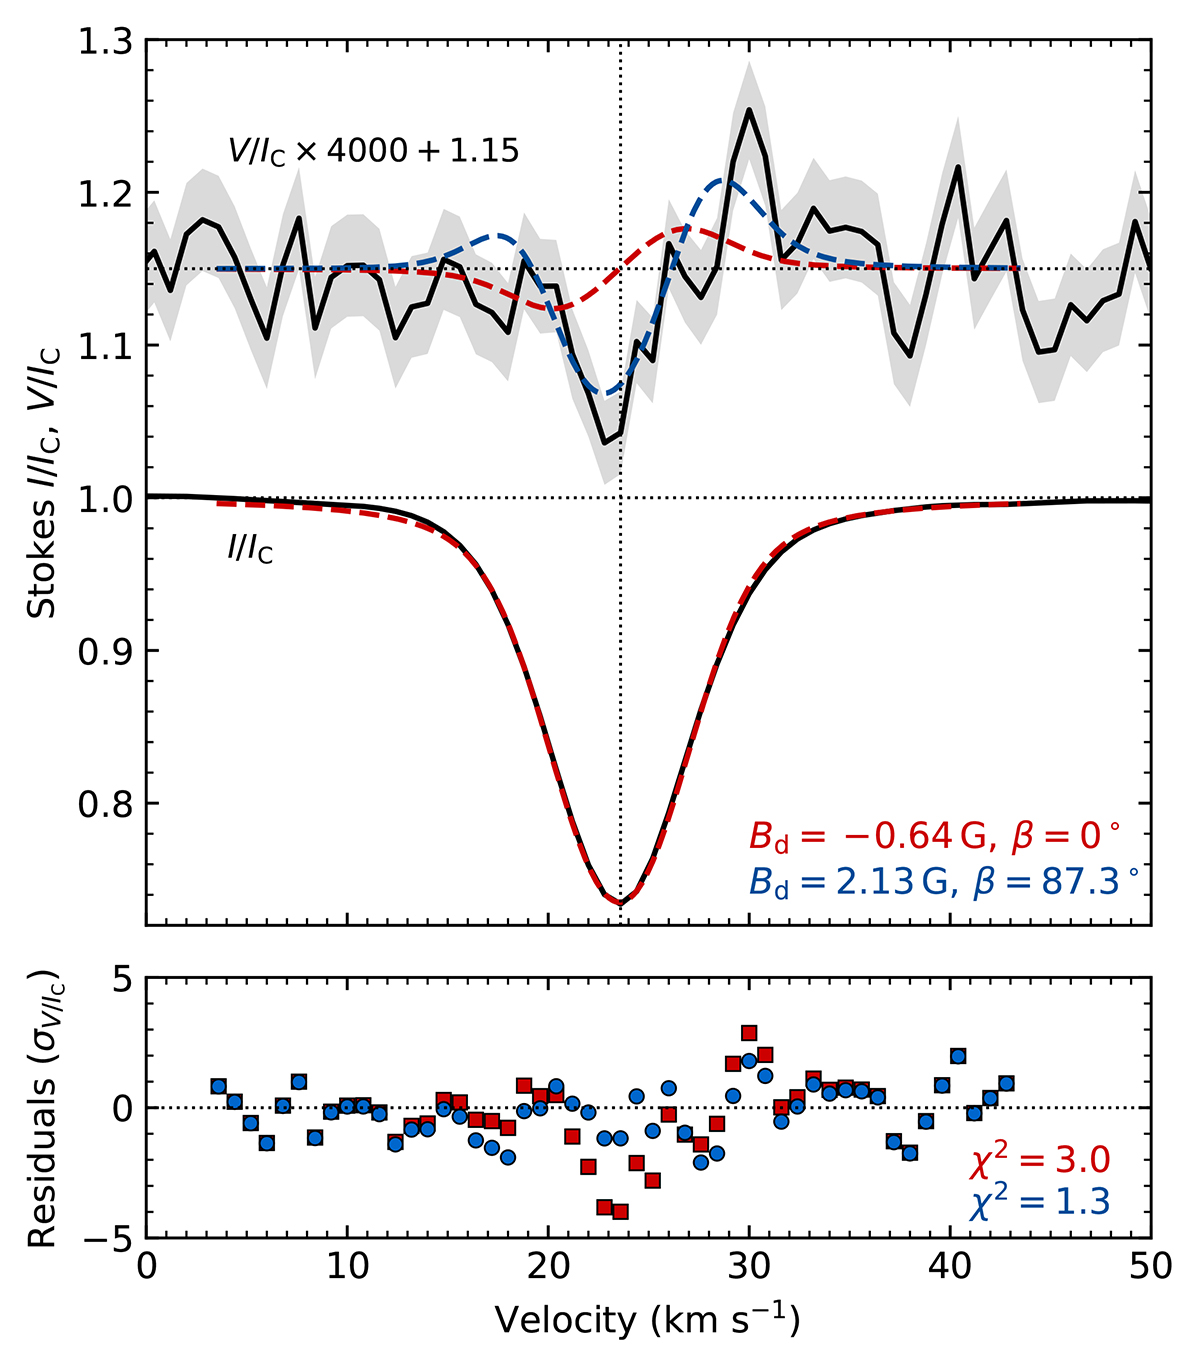
LSD Stokes V and I profiles for β Hyi derived from HARPSpol observations (top). For illustration purposes, Stokes V is scaled and shifted vertically in relation to Stokes I. The black solid line shows the mean observed profile, with the respective uncertainty indicated by the gray-shaded region. The vertical dotted line marks the line center. The red and blue lines indicate the best-fit models obtained for a dipole field, considering an axisymmetric and an inclined field, respectively. The red squares and blue circles show the corresponding residuals for the Stokes V profile (bottom). The fitting parameters and χ2 values are annotated within the panels.
Current usage metrics show cumulative count of Article Views (full-text article views including HTML views, PDF and ePub downloads, according to the available data) and Abstracts Views on Vision4Press platform.
Data correspond to usage on the plateform after 2015. The current usage metrics is available 48-96 hours after online publication and is updated daily on week days.
Initial download of the metrics may take a while.