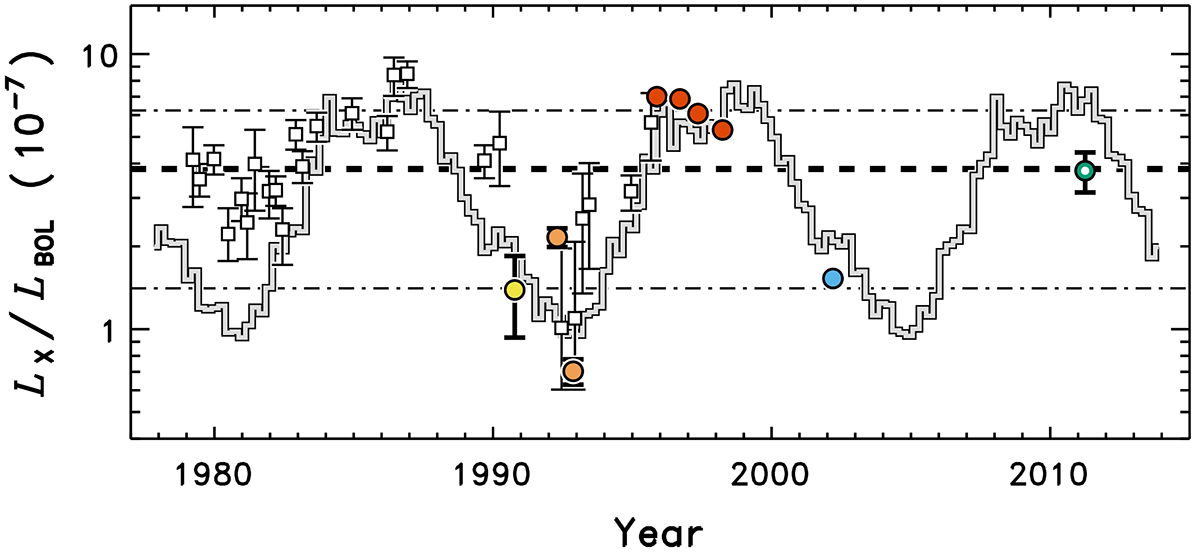
Fig. 2.

Download original image
X-ray to bolometric luminosity ratio of β Hyi (circles). The light gray curve mimics the solar X-ray variation over Cycle 24, replicated in time and stretched to a period of 12 yr, then adjusted to the apparent X-ray modulation amplitude of β Hyi. Archival ROSAT fluxes from various catalogs are shown as the yellow, orange, and red circles, XMM-Newton as the blue circle, and Chandra as the green open circle. Horizontal dashed and dot-dashed lines mark the mean normalized X-ray luminosity of β Hyi and ±1σ uncertainties. White squares represent the Mg II time-series scaled to match the amplitude of the X-ray variation.
Current usage metrics show cumulative count of Article Views (full-text article views including HTML views, PDF and ePub downloads, according to the available data) and Abstracts Views on Vision4Press platform.
Data correspond to usage on the plateform after 2015. The current usage metrics is available 48-96 hours after online publication and is updated daily on week days.
Initial download of the metrics may take a while.


