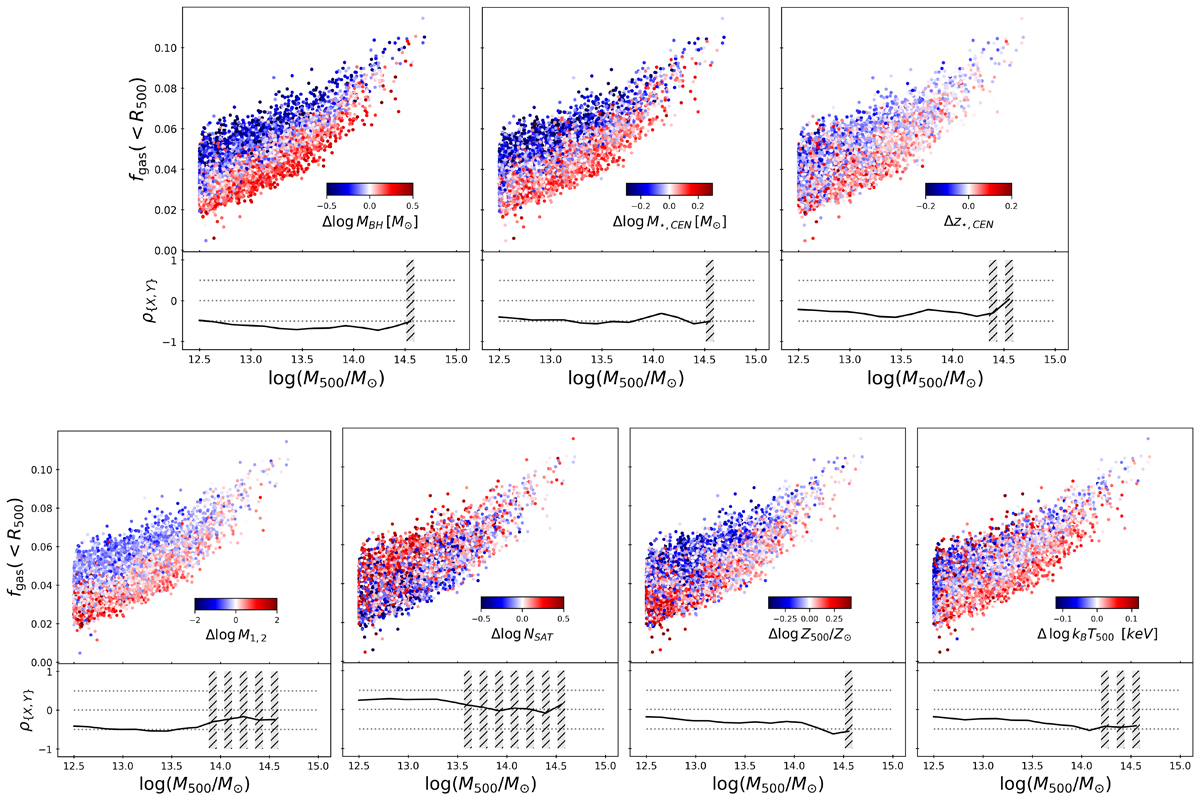
Fig. 9.
Download original image
Hot gas fraction as a function of the halo mass. The points are colour-coded for the residuals about the median of different properties as a function of the halo mass. The properties are: the BH mass Δlog MBH, the BCG stellar mass Δlog M⋆, CEN, the mean stellar formation redshift Δz⋆, CEN, the magnitude gap Δlog M1, 2, the richness Δlog NSAT, the total metallicity Δlog(Z500/Z⊙), and the total temperature Δlog(kBT500). In the bottom panels, we plot the Spearman coefficient between the hot gas fraction and the property in halo mass bins. The shaded band regions represent the bins where the p-value< 0.05. The analogue plot with X-ray luminosity in the soft band is in Fig. A.1.
Current usage metrics show cumulative count of Article Views (full-text article views including HTML views, PDF and ePub downloads, according to the available data) and Abstracts Views on Vision4Press platform.
Data correspond to usage on the plateform after 2015. The current usage metrics is available 48-96 hours after online publication and is updated daily on week days.
Initial download of the metrics may take a while.