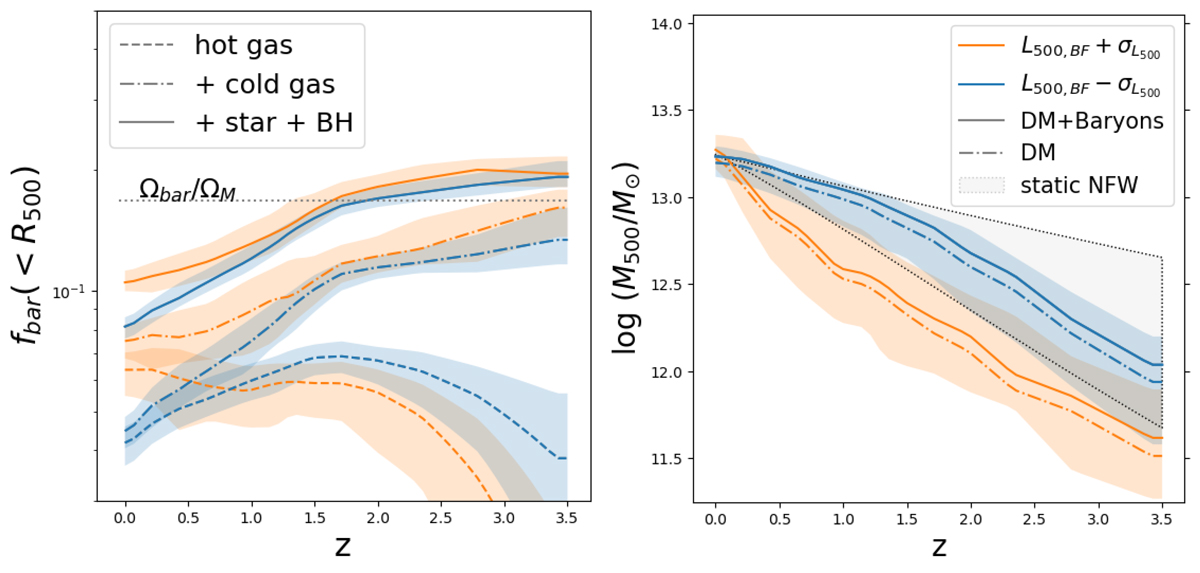
Fig. 5.
Download original image
Evolution of several halo properties for a sample of bright and faint halos in the halo mass range M500 = 1013 − 1013.5 M⊙ at z = 0. Left panel: median baryonic fraction (solid lines) across different redshifts. We also report the hot gas contribution (dashed) and total gas (dashed-dotted). The fractions are calculated within R500 of the group at the corresponding redshift. Right panel: median halo mass as a function of the simulation redshift. The dashed-dotted lines represent the contribution only from the DM. We also report the pseudo-evolution of a static NFW profile in the range of concentration of our simulated halos 3 < c500 < 10. The legend is common in all panels: the halo samples are selected from the original Magneticum cosmological box (i.e. Box2/hr). The shaded regions mark the 16–84th percentile region.
Current usage metrics show cumulative count of Article Views (full-text article views including HTML views, PDF and ePub downloads, according to the available data) and Abstracts Views on Vision4Press platform.
Data correspond to usage on the plateform after 2015. The current usage metrics is available 48-96 hours after online publication and is updated daily on week days.
Initial download of the metrics may take a while.