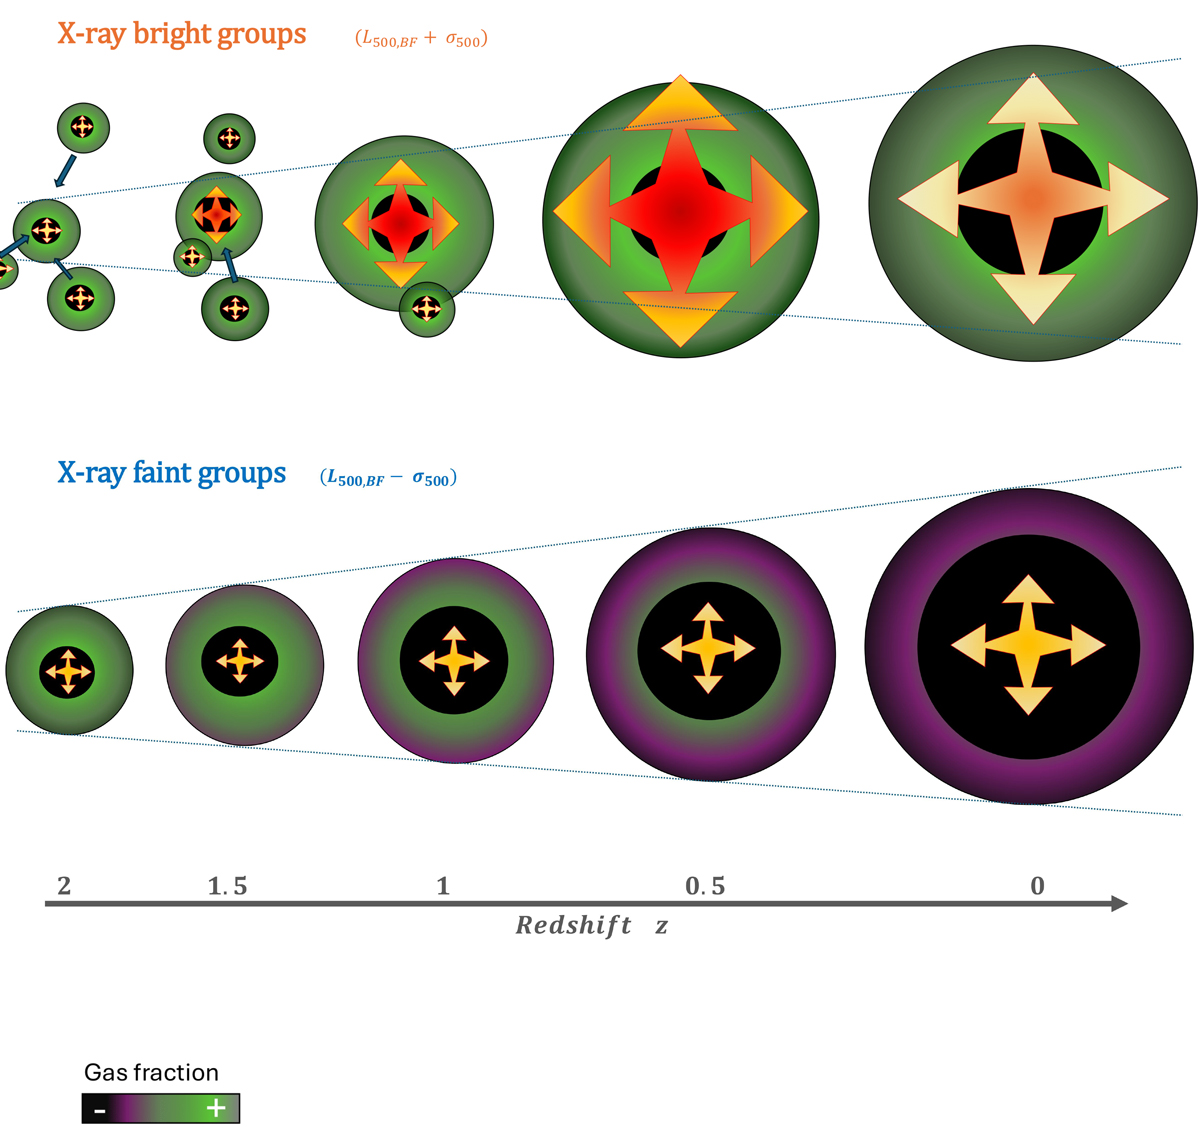
Fig. 10.
Download original image
Schematic representation of the assembly history of the bright (top) and faint (bottom) galaxy groups in the simulation. The colour scheme (shown as a green-purple gradient) represents the hot gas fraction in the halo within the virial radius, while the sizes of the circles are proportional to the halo mass. At their core, groups host SMBHs (black circles) triggered by AGN episodes at different intensities (as depicted by the coloured arrows), depending on the surrounding gas content. The BH sizes are exaggerated to highlight the difference in the MBH/Mhalo ratio between the bright and faint samples. The colour and size of the arrow hint at the strength of the AGN activity: redder and larger arrows correspond to a stronger effect. The bright sample is characterised by a fast mass accretion at the late stages of their evolution, given that they are located in dense environments, while the faint one comprises halos evolving relatively isolated in under-dense regions. The dotted lines illustrate the typical self-similar evolution expected for a DM halo with an NFW profile, fitting the evolution of the faint sample.
Current usage metrics show cumulative count of Article Views (full-text article views including HTML views, PDF and ePub downloads, according to the available data) and Abstracts Views on Vision4Press platform.
Data correspond to usage on the plateform after 2015. The current usage metrics is available 48-96 hours after online publication and is updated daily on week days.
Initial download of the metrics may take a while.