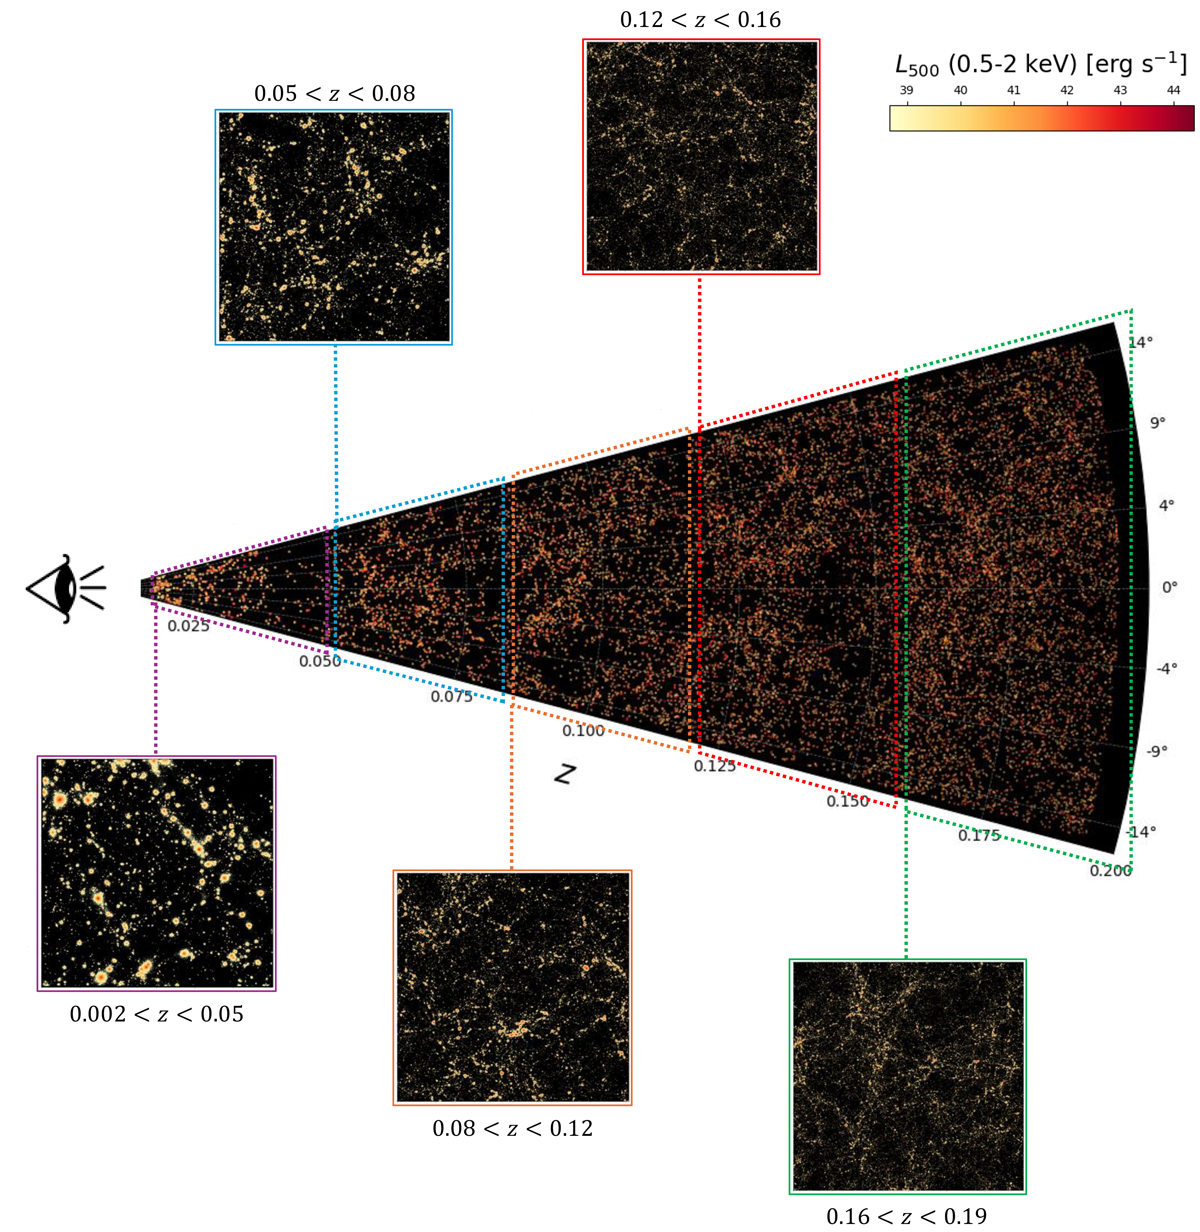
Fig. 1.
Download original image
Schematic representation of the X-ray lightcone LC30, where we show the distribution of galaxy groups and clusters with M200 > 1012.5 M⊙ and colour-coded for their intrinsic X-ray luminosity in 0.5 − 2.0 keV within R500. The X-ray emission is based on PHOX’s photon list. Each smaller panel represents the projected X-ray emission corresponding to the shells at different snapshots forming LC30 and has an angular scale of 30 × 30 square degrees.
Current usage metrics show cumulative count of Article Views (full-text article views including HTML views, PDF and ePub downloads, according to the available data) and Abstracts Views on Vision4Press platform.
Data correspond to usage on the plateform after 2015. The current usage metrics is available 48-96 hours after online publication and is updated daily on week days.
Initial download of the metrics may take a while.