| Issue |
A&A
Volume 698, June 2025
|
|
|---|---|---|
| Article Number | A218 | |
| Number of page(s) | 9 | |
| Section | Atomic, molecular, and nuclear data | |
| DOI | https://doi.org/10.1051/0004-6361/202554609 | |
| Published online | 16 June 2025 | |
Ionisation balance and equation of state of hot, dense carbon plasmas at pressures up to a few 100 Gbar
1
School of Physics, Zhejiang University of Technology, Hangzhou,
Zhejiang
310023,
PR
China
2
Institute of Atomic and Molecular Physics, Jilin University, Changchun,
Jilin
130012,
PR
China
3
College of Science, National University of Defense Technology, Changsha,
Hunan
410073,
PR
China
★ Corresponding authors: This email address is being protected from spambots. You need JavaScript enabled to view it.
; This email address is being protected from spambots. You need JavaScript enabled to view it.
Received:
18
March
2025
Accepted:
1
May
2025
Abstract
Accurately determining the ionisation balance and the equation of state (EOS) of dense plasmas is crucial for investigating the structure, evolution, and interior of stars, as well as other high-density astrophysical objects. However, it is still challenging for current experiments and theories to achieve this objective for dense plasmas at pressures up to a few 100 Gbar. Here, we modify the chemical picture of the Saha equation of plasmas and extend it into a regime up to a density of a few hundred g cm−3 based on the minimisation of the free energy of the system. The non-ideal characteristics (NIC) of the free energy, particularly the part contributed by Coulomb interactions between electrons and ions, as well as among the electrons and ions themselves, are properly accounted for by employing a local-density, temperature-dependent ion-sphere model. In such a way, the NIC effects on the ionisation potential depression, the internal partition functions of the ions, and the partition functions of the free electrons are properly considered in the modified Saha equation. Hence, the ionisation balance and EOS are self-consistently determined in this theoretical formalism. We demonstrate the capability of this modified Saha equation for solving hot, dense carbon plasmas, and find that the accurate prediction of the critical density above which the K-shell electrons become delocalised by pressure is crucial for accurately obtaining the charge state distribution and the EOS. Comparisons are made for the average degree of ionisation and EOS of carbon plasmas with available data reported in the literature. Our predicted EOS gives a result in reasonable agreement with other theoretical results below the critical density of pressure-driven K-shell delocalisation. Nevertheless, above this critical density, our prediction is systematically higher by ~25% compared to most other theories. At mass densities around 5 g cm−3, our predicted opacity of dense hydrocarbon plasmas agrees with a recent experiment studying the EOS along the principal shock Hugoniot, which can be considered a validation of our theory at this density regime.
Key words: atomic data / atomic processes / dense matter / stars: interiors / white dwarfs
© The Authors 2025
 Open Access article, published by EDP Sciences, under the terms of the Creative Commons Attribution License (https://creativecommons.org/licenses/by/4.0), which permits unrestricted use, distribution, and reproduction in any medium, provided the original work is properly cited.
This article is published in open access under the Subscribe to Open model. This email address is being protected from spambots. You need JavaScript enabled to view it. to support open access publication.
1 Introduction
Understanding ionisation balance – including the population composition of different charge states – as well as the average degree of ionisation and the equation of state (EOS) of dense carbon plasmas, is important for astrophysics (Dufour et al. 2007; Fontaine et al. 2008; Giammichele et al. 2018), inertial confinement fusion (ICF) (Hurricane et al. 2023), and many other related research fields. White dwarfs of the hot DQ class are characterised by a highly dense carbon and oxygen core surrounded by an envelope primarily composed of carbon (Dufour et al. 2007; Fontaine et al. 2008; Giammichele et al. 2018). The physical properties of EOS and opacity are the direct inputs of star structure and evolution and therefore affect the inferred surface abundances and pulsation properties of this type of white dwarfs (Dufour et al. 2007; Fontaine et al. 2008; Giammichele et al. 2018). White dwarf stars are excellent laboratories for studying the physics of matters under extreme dense conditions. However, accurately modelling pulsating stars remains difficult even at a level of precision asteroseismology, due to insufficient understanding of the microphysics (Winget & Kepler 2008) of the stars. Even for the most studied star, the Sun, the predicted internal structure disagrees with helioseismic observations (Bahcall et al. 2004). This discrepancy needs to be resolved using more accurate opacity (Basu & Antia 2008; Serenelli et al. 2009). However, the accuracy of opacity depends sensitively on the accuracy of the population composition of different charge states in the plasmas.
The EOS is closely related to the ionisation balance. However, accurate determination of the ionisation balance of dense plasmas is challenging both experimentally and theoretically (Kritcher et al. 2020; Kraus et al. 2016; Zeng et al. 2023). In ICF experiments, hydrodynamic instability is a key factor in achieving ignition (Abu-Shawareb et al. 2022), and its growth has been demonstrated to be sensitively dependent on the accuracy of EOS (Clark et al. 2010; Hammel et al. 2010). Most recently, the relationship between pressure and density along the principal shock Hugoniot of hydrocarbon was experimentally measured to a high precision within 5%, which is relevant for the EOS at a pressure range of 100–450 Mbar (Kritcher et al. 2020). However, these experiments were limited to mass densities below or around 10 g cm−3, although experiments on ionisation balance are extended to extremely dense Be plasmas at a mass density of 55 g cm−3 using the X-ray scattering technique (Döppner et al. 2023). Moreover, an experimental platform for the National Ignition Facility that uses spherically converging shock waves was developed for absolute EOS measurements along the principal Hugoniot (Döppner et al. 2018).
Theoretically, a realistic description of ionisation balance for extremely dense plasmas is difficult due to the complex interactions among the particles. Thus, dense carbon plasmas have attracted a great deal of interest in this area of study over the past few years. As current predictions of the ionisation degree by widely used analytical models have been challenged by a series of experiments, an approach of density functional theory molecular dynamics (DFT-MD) simulations has been proposed to calculate the ionisation degree of carbon plasmas directly from dynamic electrical conductivity using the Thomas-Reiche-Kuhn sum rule at Gbar pressures (Bethkenhagen et al. 2020). Exploration of mean ionisation states was carried out using Kubo-Greenwood conductivity based on the average atom (AA) model (Callow et al. 2023). Considering the inconsistencies between the predictions obtained by the AA models and by the electronic transport properties (Bethkenhagen et al. 2020), Clerouin et al. (2022) proposed two definitions of ionisation based on the plasma structure as given by the pair distribution function and on the total pressure. They show the equivalence of these two definitions on dense carbon plasmas along the 100 eV isotherm and the 10 g cm−3 isochor. Ovechkin et al. (2023) investigated plasma ionisation balance and average ion charges in the chemical picture based on the AA model. Gawne et al. (2024) sought a consistent and unambiguous definition for the ionisation state using two potential definitions, with one based on counting the number of continuum electrons and the other on the optical conductivity by finite-temperature DFT calculations. For the ionisation state of carbon in CH plasmas, differences of up to 10% are found between the two methods. The physical effects of Pauli blocking (PB) of bound-states on the ionisation potential depression (IPD) and the average degree of ionisation were studied using a many-body quantum statistical approach for dense carbon plasmas at extreme densities up to 40 g cm−3 (Röpke et al. 2019). Recently, an approach based on first-principles quantum Monte Carlo simulations was proposed to investigate the IPD and Fermi barrier in warm dense matter (Bonitz & Kordts 2025).
The EOS of carbon was investigated theoretically in a density range of 3–20 g cm−3 by combining the DFT, the liquid free energy model, and the path integral quantum Monte Carlo calculations (Benedict et al. 2014). These investigations into dense carbon plasmas are likewise important for carbon-hydrogen mixtures (Zhang et al. 2018; Hollands et al. 2020). The EOS, transport, and optical properties of dense polystyrene for practical applications can be found in a recent review paper (Hu et al. 2018). Determining the exact plasma conditions at which the transition of K-shell delocalisation occurs, as well as the magnitude of K-shell modifications preceding it, remains challenging both experimentally and theoretically (Döppner et al. 2023). Later, Bethkenhagen et al. (2023) studied the EOS, Hugoniot, pair distribution functions, and diffusion coefficients for carbon plasmas near the principal Hugoniot at densities spanning from 8 g cm−3 to 16 g cm−3 and temperatures ranging from 100 kK to 10 MK, by employing the Kohn-Sham DFT-MD method.
Herein, we extend the study of the ionisation balance of carbon plasma from a density of ~10 g cm−3 (Zeng et al. 2020a) to a regime of K-shell delocalisation at extremely dense conditions with a pressure reaching a few 100 Gbar. Based on the minimisation of the Helmholtz free energy of a dense plasma, a unified and self-consistent theoretical formalism for ionisation balance and EOS is constructed, in which all the physical quantities required to determine the population distribution of different charge states in the ionisation balance are obtained self-consistently using the same plasma screening potential. The non-ideal effects on the atomic properties and on the ionisation balance are taken into account by properly considering the interactions between the electrons and ions, and among the electrons themselves (Zeng et al. 2023; Huang et al. 2024).
A few past models share some common features with the present plasma model discussed here. Potekhin et al. (2005) (PMC05) investigated the EOS for partially ionised carbon in a wide range of densities using free energy minimisation within the framework of the chemical picture of plasmas. In their approach, each electronic configuration was treated with its own neutrality volume separately, as in the study (Fu et al. 2018). The long-range Coulomb contributions were then added separately, using previous results for the free energy of fully ionised plasmas. Starrett & Saumon (2012) proposed a fully variational AA model with the DFT method and the hypernetted chain (HNC) approximation for the ion-ion correlations. The differences between the present approach and that used in PMC05 are as follows: PMC05 considered the long-range Coulomb contributions separately, using previous results for the free energy of fully ionised plasmas, whereas in the present work, the Coulomb interactions are included within the HNC approximation. The main difference between our work and that of Starrett & Saumon (2012) is that they used a fully variational AA model with the DFT method, while we specified the ionic stages using the Saha equation.
2 Theoretical method
The free-energy minimisation method is a universal tool for determining the ionisation balance and producing the EOS for plasmas. Here, the minimisation procedure is based on the ‘chemical picture’ in which one identifies particle clusters (atoms, ions, and molecules) as distinct particle species within the plasma (Ebeling et al. 1977; Mihalas et al. 1988). If molecule formation can be ignored in a moderately high-temperature plasma, then only the electrons and ions of different charge states are treated explicitly. In this chemical picture, the free energy of a plasma volume V at temperature T consists of the following: the translational part of the ions (F1), the part associated with the internal excitation of the species with excited states (F2), the free energy of the ideal free electrons (F3), and the free energy from Coulomb interactions among all charged particles (ions and electrons) in the plasma (F4). This is given as
![Mathematical equation: $\[F\left(T, V,\left\{N_i\right\}\right)=F_1+F_2+F_3+F_4,\]$](/articles/aa/full_html/2025/06/aa54609-25/aa54609-25-eq1.png) (1)
(1)
where
![Mathematical equation: $\[F_1=-k T \sum_i N_i\left(\frac{3}{2} ~\ln~ T+~\ln~ V-\ln N_i+\frac{3}{2} ~\ln~ \frac{2 \pi m_i k}{h^2}+1\right),\]$](/articles/aa/full_html/2025/06/aa54609-25/aa54609-25-eq2.png) (2)
(2)
![Mathematical equation: $\[F_2=\sum_i N_i(E_{1, i}-k T ~\ln~ Z_i),\]$](/articles/aa/full_html/2025/06/aa54609-25/aa54609-25-eq3.png) (3)
(3)
![Mathematical equation: $\[F_3=-k T ~N_e\left[\frac{3}{2} \frac{F_{3 / 2}(\eta)}{F_{1 / 2}(\eta)}-\eta\right].\]$](/articles/aa/full_html/2025/06/aa54609-25/aa54609-25-eq4.png) (4)
(4)
Here, the occupation number {Ni} refers to the number of particles in charge state i contained within volume V in thermodynamic equilibrium; E1,i and Zi [see the detailed expression in Eq. (10)] are the ground state energy and the internal partition function of the charge state i, respectively; k is the Boltzmann’s constant; mi is the ionic mass of the charge state i; and Ne is the population number of free electrons. Further details on F1, F2, and F3 can be found in the referenced literature (Mihalas et al. 1988; Graboske et al. 1969). In the following expression, Fn(η) is the standard Fermi-Dirac integral of order n, and η is the degeneracy parameter, which is related to the number of electrons by
![Mathematical equation: $\[F_{1 / 2}(\eta)=\frac{\sqrt{\pi}}{G_e} \frac{N_e}{V T^{3 / 2}},\]$](/articles/aa/full_html/2025/06/aa54609-25/aa54609-25-eq5.png) (5)
(5)
where
![Mathematical equation: $\[G_e=\left(\frac{2 \pi m_e k}{h^2}\right)^{3 / 2},\]$](/articles/aa/full_html/2025/06/aa54609-25/aa54609-25-eq6.png) (6)
(6)
and me is the rest mass of an electron.
The most challenging part is the calculation of F4, where the Coulomb interactions are influenced by complex plasma screening and other intricate physical effects. The free energy of Coulomb interactions among the charged particles (i.e. ions and free electrons) in the plasma can be determined by the radial distribution function
![Mathematical equation: $\[\begin{aligned}F_4= & \sum_{i<j} \frac{N N_i}{2 V} \int d \boldsymbol{r} \frac{q_i q_j e^2}{r} h_{i i}(r)\left[g_{i j}(r)-1\right]+\frac{\left(N_e\right)^2}{2 V} \int d \boldsymbol{r} \frac{e^2}{r} \\& \times h_{e e}(r)\left[g_{e e}(r)-1\right]-\sum_i \frac{N_e N_i}{2 V} \int d \boldsymbol{r} \frac{q_i e^2}{r} h_{i e}(r)\left[g_{i e}(r)-1\right],\end{aligned}\]$](/articles/aa/full_html/2025/06/aa54609-25/aa54609-25-eq7.png) (7)
(7)
where N is the total ionic number; qi refers to the charge number of the charge state i in the unit of electron charge; and gij(r), gee(r), and gie(r) represent the radial distribution function between the charge state i and j, the free electrons, and the charge state i and the free electrons, respectively. The plasma screening factors hii(r), hie(r), and hee(r) describe the screening of Coulombic interaction between the charged particles in the plasma. In the AA model, details on obtaining these radial distribution functions can be found in the reference (Hou et al. 2015). The free energy of Coulomb interactions between the electrons, and between the electrons and ions, is incorporated through the non-ideal characteristics (NIC) correction in the free electron partition function calculation below. Therefore, these contributions should not be counted again in the present calculation.
The free energy F(T, V, {Ni}) is minimized with respect to all variations permitted by the stoichiometric relations for the ionisation equilibrium process from charge state i to a higher state i + 1 plus an electron. This yields
![Mathematical equation: $\[\frac{\partial F}{\partial N_i}-\frac{\partial F}{\partial N_{i+1}}-\frac{\partial F}{\partial N_e}=0.\]$](/articles/aa/full_html/2025/06/aa54609-25/aa54609-25-eq8.png) (8)
(8)
In this context, the population number Ni+1 of charge state i + 1 in a phase space d3rd3p at a spatial position r and momentum p is determined by
![Mathematical equation: $\[\frac{N_{i+1}^{r p}}{N_i}=\frac{Z_{i+1}}{Z_i} \frac{1+X_{i+1}}{1+X_i} \frac{1}{N_e} \frac{2 d^3 \boldsymbol{r} d^3 \boldsymbol{p}}{h^3} e^{-\frac{\phi_i-\Delta \phi_i}{k T}} \times \frac{e^{\frac{\mu_i}{k T}}}{e^{\frac{\epsilon+\left[V_i(r)+V_{s c r}(r)\right]+\mu_i}{k T}}+1},\]$](/articles/aa/full_html/2025/06/aa54609-25/aa54609-25-eq9.png) (9)
(9)
where Zi is the partition function of charge state i, Ne is the population number of free electrons, ϕi is the ionisation potential (IP) of isolated charge state i, Δϕi is the IPD for ions belonging to the charge state i due to the plasma environment, μi is the chemical potential of charge state i in the plasma (determined by requiring that the integrated free electron number equals the number of ionised electrons for charge state i), and ε is the kinetic energy of the free electron. In the above expression, h is the Planck constant, and k is the Boltzmann constant.
The internal partition function Zi of the charge state i is determined by the energies Ej,i of all possible bound quantum states in the dense plasma, relative to the ground state energy E1,i, and their statistical weights gj,i, as follows:
![Mathematical equation: $\[Z_i=\sum_j g_{j, i} e^{-\left[E_{j, i}-E_{1, i}\right] / k T}.\]$](/articles/aa/full_html/2025/06/aa54609-25/aa54609-25-eq10.png) (10)
(10)
The term Xi in Eq. (9) originates from the inter-ionic correlation (Fu et al. 2018), given by
![Mathematical equation: $\[X_i=\frac{1}{\sigma_{i j}} \sum_j \frac{N_j}{V} \int\left(e^{\frac{V_{i j}(r)}{k T}}-1\right) 4 \pi r^2 d r,\]$](/articles/aa/full_html/2025/06/aa54609-25/aa54609-25-eq11.png) (11)
(11)
where σij=2 if i = j, and σij=1 if i ≠ j. Vij(r) is the pair potential of ions i and j. The factor (1 + Xi+1)/(1 + Xi) in Eq. (9) reflects the effect of ion coupling on the Saha equation (Fu et al. 2018). The total potential includes the single-electron effective potential Vi(r) of the isolated charge state i, without the influence of the plasma environment, and the screening potential Vscr(r) arising from the plasma environment. By integrating over the phase space, we obtain the modified Saha equation,
![Mathematical equation: $\[\frac{N_{i+1} N_e}{N_i}=\frac{b_i Z_e Z_{i+1}}{Z_i} \frac{1+X_{i+1}}{1+X_i} e^{-\frac{\phi_i-\Delta \phi_i}{k T}},\]$](/articles/aa/full_html/2025/06/aa54609-25/aa54609-25-eq12.png) (12)
(12)
where Ze is the partition function of the free electrons which are assumed to be uniform and ideal, and thus equivalent for all charge states:
![Mathematical equation: $\[Z_e=2\left(\frac{2 \pi m_e k T}{h^2}\right)^{3 / 2},\]$](/articles/aa/full_html/2025/06/aa54609-25/aa54609-25-eq13.png) (13)
(13)
In dense plasmas, the partition functions of the free electrons belonging to different charge states vary. The expression biZe represents the partition function of the free electrons associated with charge state i, where bi is given by
![Mathematical equation: $\[\begin{aligned}b_i= & \frac{1}{\int_0^{R_0} 4 \pi r^2 d r} \int_0^{R_0} d r \int_0^{\infty} d \epsilon \frac{8 \pi}{h^3}\left(2 m_e\right)^{\frac{3}{2}} r^2 \epsilon^{\frac{1}{2}} \\& \times \frac{e^{\frac{\mu_i}{k T}}}{e^{\frac{\epsilon+\mid V_i(r)+V_{s c r}(r)+\mu_i}{k T}}+1}.\end{aligned}\]$](/articles/aa/full_html/2025/06/aa54609-25/aa54609-25-eq14.png) (14)
(14)
In the above equation, R0 denotes the radius of a spherical volume containing the ion of charge state i, determined by the matter density as ![Mathematical equation: $\[R_{0}=\left(\frac{3}{4 \pi n_{\text {ion}}}\right)^{\frac{1}{3}}\]$](/articles/aa/full_html/2025/06/aa54609-25/aa54609-25-eq15.png) , with nion being the ion number density. By including the NIC effects on the free electron partition functions, the standard Saha equation is generalised to a dense plasma regime. The above Saha equation can be solved self-consistently together with the constraint of particle and charge conservation:
, with nion being the ion number density. By including the NIC effects on the free electron partition functions, the standard Saha equation is generalised to a dense plasma regime. The above Saha equation can be solved self-consistently together with the constraint of particle and charge conservation:
![Mathematical equation: $\[N=\sum_i N_i,\]$](/articles/aa/full_html/2025/06/aa54609-25/aa54609-25-eq16.png) (15)
(15)
![Mathematical equation: $\[N_e=\sum_i q_i N_i.\]$](/articles/aa/full_html/2025/06/aa54609-25/aa54609-25-eq17.png) (16)
(16)
Once the free energy F and the charge state distribution (CSD) {Ni} are determined by solving the modified Saha equation, the pressure can be obtained as
![Mathematical equation: $\[p=\left.\frac{\partial F}{\partial V}\right|_{T,\left\{N_i\right\}}\]$](/articles/aa/full_html/2025/06/aa54609-25/aa54609-25-eq18.png) (17)
(17)
by direct differentiation of the free energy F. Because the above equations satisfy the Maxwell relations, thermodynamic consistency of these variables is guaranteed (Mihalas et al. 1988). Since both the modified Saha equation and the pressure are derived from the minimisation of the free energy, the present theoretical formalism can, in principle, be applied to plasmas up at arbitrary high densities, provided that the NIC affecting the IPDs, the free energy, and other physical quantities related to the ionisation balance equation are properly taken into account. However, considering all these NIC effects is a challenging task.
Most previous studies omitted certain physical effects, such as treating free electrons in plasmas as an ideal gas. This made it difficult to apply their theoretical methods to extremely dense plasmas. However, some studies, such as Potekhin et al. (2005), treated free electrons consistently with the effective one-electron potential of the ions.
All the relevant data required to solve the modified Saha equation are obtained by solving the Dirac equation for each charge state (atomic units are used here unless otherwise specified), as follows:
![Mathematical equation: $\[\begin{array}{r}{\left[\sum_{i=1}^M c \alpha \bullet p_i+(\beta-1) c^2+V_i^{n u c}(r)+\sum_{i<j}^M \frac{1}{r_{i j}}+V_{s c r}(r)\right] \psi(\boldsymbol{r})} \\=E \psi(\boldsymbol{r}),\end{array}\]$](/articles/aa/full_html/2025/06/aa54609-25/aa54609-25-eq19.png) (18)
(18)
where M denotes the number of bound electrons in the respective ion, α and β are the Pauli matrices, and Vscr(r) is the plasma screening potential. The rest energy c2 is subtracted out in the above equation. The plasma screening potential Vscr(r) is determined by the radial distribution function of the charge density of the free electrons ρ(r) (Son et al. 2014; Zeng et al. 2020a,b)
![Mathematical equation: $\[V_{s c r}(r)=4 \pi\left[\frac{1}{r} \int_0^r r_1+\int_r^{R_0}\right] r_1 \rho\left(r_1\right) \mathrm{d} r_1-\frac{3}{2}\left[\frac{3}{\pi} \rho(r)\right]^{1 / 3}.\]$](/articles/aa/full_html/2025/06/aa54609-25/aa54609-25-eq20.png) (19)
(19)
The free-electron charge density distribution function follows the Fermi-Dirac distribution,
![Mathematical equation: $\[\rho(r)=\frac{1}{\pi^2} \int_{k_0(r)}^{\infty} \frac{k^2 d k}{e^{\frac{\sqrt{k^2 c^2+c^4}-c^2+V_{s c r}(r)+\mu_i}{k T}}+1},\]$](/articles/aa/full_html/2025/06/aa54609-25/aa54609-25-eq21.png) (20)
(20)
where c denotes the speed of light in vacuum, p is the free-electron momentum, and ![Mathematical equation: $\[p_{0}(r)=\frac{\sqrt{-2 V(r) c^{2}+V(r)^{2}}}{c}\]$](/articles/aa/full_html/2025/06/aa54609-25/aa54609-25-eq22.png) . If Vscr(r) is omitted in the above Dirac equation, then it corresponds to the atomic structure and properties of the isolated ion. The IP of charge state i is determined by the energy difference between the respective ground levels of charge states i and i + 1. By solving the Dirac equation of charge state i of both the isolated ion (without including Vscr(r)) and the screened ion embedded in the plasma (including Vscr(r)), the IPD, Δϕi, of the charge state i – required for solving the Saha equation – can be obtained as the difference between the IPs of the isolated ion and the screened ion. Further details on solving the Dirac equation can be found in the flexible atomic code (Gu 2008).
. If Vscr(r) is omitted in the above Dirac equation, then it corresponds to the atomic structure and properties of the isolated ion. The IP of charge state i is determined by the energy difference between the respective ground levels of charge states i and i + 1. By solving the Dirac equation of charge state i of both the isolated ion (without including Vscr(r)) and the screened ion embedded in the plasma (including Vscr(r)), the IPD, Δϕi, of the charge state i – required for solving the Saha equation – can be obtained as the difference between the IPs of the isolated ion and the screened ion. Further details on solving the Dirac equation can be found in the flexible atomic code (Gu 2008).
The basis states of the atomic wave functions are constructed from the products of N one-electron Dirac spinors,
![Mathematical equation: $\[\varphi_{n \kappa m}=\frac{1}{r}\binom{P_{n \kappa}(r) \chi_{\kappa m}(\theta, \psi, \sigma)}{i Q_{n \kappa}(r) \chi_{-\kappa m}(\theta, \psi, \sigma)},\]$](/articles/aa/full_html/2025/06/aa54609-25/aa54609-25-eq23.png) (21)
(21)
where Pnk(r) and Qnk(r) are the large and small components of the radial wave functions, χκm(θ, ψ, σ) is a two-component spherical spinor, and n, κ, and m denote the principal, the relativistic angular, and the magnetic quantum numbers of the electron orbital, respectively. The large and small components of the radial wave function satisfy the coupled equations,
![Mathematical equation: $\[\begin{aligned}& \left(\frac{d}{d r}+\frac{\kappa}{r}\right) P_{n \kappa}=\alpha\left(\varepsilon_{n \kappa}-V(r)+\frac{2}{\alpha^2}\right) Q_{n \kappa} \\& \left(\frac{d}{d r}-\frac{\kappa}{r}\right) Q_{n \kappa}=\alpha\left(-\varepsilon_{n \kappa}+V(r)\right) P_{n \kappa},\end{aligned}\]$](/articles/aa/full_html/2025/06/aa54609-25/aa54609-25-eq24.png) (22)
(22)
where α denotes the fine-structure constant, V(r) represents the self-consistent potential including contributions from both the bound electrons and the plasma screening potential Vscr(r) from the free electrons, and εnκ is the energy eigenvalue of the electron orbital relative to the potential at the ion sphere boundary.
The radial wave function is solved inside the ion sphere with the following boundary conditions for the radial wave function of a bound orbital (Hou et al. 2006):
![Mathematical equation: $\[P_{n k}(0)=Q_{n k}(0)=0\]$](/articles/aa/full_html/2025/06/aa54609-25/aa54609-25-eq25.png) (23)
(23)
and
![Mathematical equation: $\[P_{n \kappa}\left(R_0\right)=0.\]$](/articles/aa/full_html/2025/06/aa54609-25/aa54609-25-eq26.png) (24)
(24)
In the above theoretical formalism, we used a non-relativistic expression of the thermodynamic free energy in practical calculations. However, the relativistic Dirac equation must be used to describe the atomic structure and properties in order to obtain the physical quantities required for calculating the free energy, such as the internal partition functions. This is because the relativistic effects cannot be ignored for the inner-shell orbitals of medium and heavy elements. The use of the relativistic FermiDirac distribution is justified for the same reason as the use of the Dirac equation. The local kinetic energy of a free electron close to the nucleus can reach tens of thousand eV. Therefore, relativistic effects should be included.
3 Results and discussion
In Fig. 1, we show the prediction of IPDs (black lines, left y axis) and IPs (blue lines, right y axis) for the charge states of C2+ through C5+ as a function of mass density in carbon plasmas at temperatures of 50, 200, and 500 eV. Results are presented for both our theoretical model and for the analytical models of the Stewart–Pyatt (SP) (Stewart & Pyatt 1966) and the EckerKröll (EK) (Ecker & Kröll 1963) at a temperature of 200 eV. As shown, all the theories predict an evident lowering of IPs – even at a lower density for all charge states. The IPDs essentially show an increasing effect with increasing mass density. However, they are also temperature dependent, and their values slightly decrease as the temperature increases. Among the theories, the EK model predicts the highest IPD, while the SP model predicts the lowest IPD. Our results lie between the two, demonstrating a better agreement with experimental values, as also reported in previous publications (Zeng et al. 2020a,b; Huang et al. 2024).
As shown in Fig. 1, the 2s electron becomes delocalised in C2+ at a mass density of 1.55 and in C3+ at 1.68 g cm−3, both at a temperature of 50 eV. With increasing temperature, the density at which the transition from a bound electron orbital to delocalisation occurs increases slightly, reaching 1.73 and 1.85 g cm−3, at a temperature of 200 eV, respectively. However, the K-shell delocalisation of C4+ and C5+ occurs at much higher mass densities of 228 and 256 g cm−3, respectively, at a temperature of 200 eV. We later demonstrate that the K-shell delocalisation is crucial for determining the CSD and the EOS.
Accurate prediction of IPDs of ions in dense plasmas is crucial for determining the ionisation balance. In particular, the precise determination of the K-shell delocalisation depends sensitively on the IPDs. The advancement of experimental technology makes it now feasible to quantitatively measure the IPDs of ions at a solid density (Ciricosta et al. 2012, 2016), or even a few times the solid density (Hoarty et al. 2013; Fletcher et al. 2014). An experimental platform was developed to measure the IPD – one of the most essential factors in determining the ionisation degree of plasmas – using spectrally resolved X-ray scattering (Kraus et al. 2016, 2019). Our previous predictions on IPDs based on our model, as mentioned above, agree with these experimental measurements (Zeng et al. 2020a; Huang et al. 2024) and, hence, supports the reliability of our theoretical predictions for dense carbon plasmas as well.
Another factor that influences the CSD and ionisation balance is the NIC effect on the partition functions of the free electrons in dense plasmas. The relative partition functions of the free electrons are shown in Fig. 2 for the charge states C4+ and C5+ in dense carbon plasmas at mass densities of 3, 10, 100, and 200 g cm−3 at a temperature of 200 eV. As shown, the partition functions of free electrons of different charge states of carbon ions are reduced compared to those in ideal plasmas.
Using the obtained IPDs and the partition functions of free electrons, the Saha ionisation balance equation can be solved with the NIC effect taken into account. As examples, Fig. 3 shows the population fractions of different charge states of carbon ions at mass densities of 5, 100, and 235 g cm−3 and at temperatures of 50, 100, 200, and 500 eV. For comparison, the CSDs calculated without including the NIC effect on the partition functions of free electrons are also shown, in order to evaluate this non-ideal effect on the CSDs. At the lowest indicated mass density of 5 g cm−3, nearly all the ions are C4+ at temperatures below 50 eV. In this case, the NIC effect on the CSDs, arising from the partition functions of free electrons, is greatly restrained, resulting in nearly identical values with and without the inclusion of the NIC effect. As the temperature increases to 100 and 200 eV, this non-ideal effect becomes stronger than at 50 eV. However, as the temperature increases further to 500 eV, this non-ideal effect becomes much weaker again, and the most abundant charge state is the bare ion, C6+. At a mass density of 100 g cm−3, similar to 5 g cm−3, the NIC effect on the CSDs resulting from the partition functions of free electrons is also negligible at temperatures below 50 eV. However, this non-ideal effect exerts a more noticeable influence on the CSDs at temperatures above 50 eV. At a mass density of 235 g cm−3, the charge state of C4+ disappears as a result of K-shell delocalisation. In this case, the non-ideal effect exerts noticeable influence on the CSDs, even at a higher temperature of 500 eV.
Figure 4 shows the average degree of ionisation of dense carbon plasmas as a function of mass density up to 300 g/cm3 at temperatures of 50, 100, 150, 200, 250, 300, 500, and 800 eV. Results for the average degree of ionisation are provided with and without considering the NIC effect on the partition functions of free electrons in the plasmas. The dynamical effect of the dense plasma environment on the ionisation balance was taken into account when calculating the average degree of ionisation. This was obtained by accounting for the dynamical broadening effect of the plasma on the energy levels and ionisation threshold of all the relevant charge states (Hou et al. 2006). We find that the NIC effect on the average degree of ionisation is negligible at and below 50 eV, consistent with the CSD predictions shown in Fig. 3. As the plasma temperature increases to 300 eV, this effect becomes increasingly significant. However, at temperatures above 800 eV, the NIC effect gradually weakens again. Studies to date demonstrate that the NIC effect influences the ionisation balance in dense plasmas, and that including this effect leads to improved agreement with experimental measurements (Zeng et al. 2023; Huang et al. 2024).
For all the plasma temperatures considered, as shown in Fig. 4, a pressure-induced ionisation process is predicted for the K-shell electrons of the C4+ and C5+ charge states. Moreover, the mass density at which K-shell delocalisation occurs also depends on temperature, generally shifting to higher densities as the plasma temperature increases. Below a mass density of ~180 g cm−3, thermal ionisation dominates the ionisation balance of dense plasma across all studied temperatures. However, the average degree of ionisation rises sharply to 5.0 at densities above ~217 g cm−3, and further increases to 6.0 at densities above ~246 g cm−3. The first steep increase in the average degree of ionisation corresponds to the K-shell delocalisation of C4+, making C5+ the dominant ion type. The second steep increase in the average degree of ionisation corresponds to the K-shell delocalisation of C5+, leading to a plasma consisting entirely of bare ions and an average degree of ionisation of 6.0. Above the K-shell delocalisation density threshold, pressure-induced ionisation plays a more important role than thermal ionisation, particularly at lower temperatures. Below the pressure-induced ionisation threshold, the ionisation balance displays typical features of thermal ionisation: the average degree of ionisation increases with rising plasma temperature and decreases with increasing mass density.
Figure 4 illustrates the interplay between pressure-induced K-shell ionisation and thermal ionisation, with the competition between these processes becoming increasingly evident at higher plasma temperatures. At the lowest temperature considered here (i.e. 50 eV), the average degree of ionisation remains nearly constant at 4.0, reflecting the delocalisation of the L-shell electrons from C3+ ions. Here, pressure-induced L-shell ionisation dominates the plasma balance. Thermal ionisation can only be observed at the lowest mass densities, below ~2 g cm−3. Additionally, an anomalous phenomenon is predicted: the average degree of ionisation increases slightly as the mass density rises up to ~180 g cm−3. Such a phenomenon is attributed to the increasing IPDs of carbon ions with rising mass density. At higher temperatures, this anomaly disappears, and the average degree of ionisation decreases with increasing mass density. Below the pressure-induced K-shell ionisation threshold, thermal ionisation plays an increasingly important role in the ionisation balance as mass density increases. Accurately determinating the pressure-induced K-shell ionisation threshold is therefore vital for describing the competition between pressure-induced K-shell ionisation and thermal ionisation.
In Fig. 5, we compare our theoretical results for the average degree of ionisation of dense carbon plasma at a temperature of 100 eV as a function of mass density with other widely used ionisation models in astrophysics and inertial confinement fusion. Among all the theories, the calculation carried out by Potekhin, Massacrier, and Chabrier (i.e. PMC05, performed at a slightly lower temperature of 106 K compared to the 100 eV considered here) (Potekhin et al. 2005) predicts a mass density threshold for pressure-induced K-shell ionisation (~200 g cm−3) that is closest to our theoretical result. Above a density of 200 g cm−3, our predictions are in reasonable agreement with that by PMC05. However, below this density threshold, there is significant discrepancy: PMC05 predicts that the average degrees of ionisation increases with rising mass density, exhibiting three local minima at mass densities of ~1.1, ~2.2, and ~190 g cm−3. In contrast, our prediction yields a decreasing average degree of ionisation as mass density increases. We still do not understand why the PMC05 results exhibit the three local minima. A similar difference is also observed for the DFT-MD results (Bethkenhagen et al. 2020), which closely follow the referred PMC05 (Potekhin et al. 2005) results. There is overall reasonable consistency between our results and those of the neutral pseudoatom (NPA) model (Dharma-wardana 2021), which predicts a slower rise in the average degree of ionisation at densities above ~100 g cm−3. At ~300 g cm−3, the ATOMIC model (Hakel et al. 2006) predicts a higher threshold of pressure-induced K-shell ionisation than ours. The Beth-Uhlenbeck (BU) calculations – obtained via Eq. (15) in the reference (Röpke et al. 2019) – which take into account the PB effects (short-dashed black line) predict a much lower density threshold of pressure-induced K-shell ionisation at ~20 g cm−3.
Other theories either predict a much lower density threshold of pressure-induced K-shell delocalisation, accompanied by much smoother and softer increase in the average degree of ionisation with increasing mass density (e.g. DFT-MD (Bethkenhagen et al. 2020), PURGATORIO (Sterne et al. 2007), the quantum AA model (QAAM) (Faussurier et al. 2021), and the NPA model (Dharma-wardana 2021)), or do not predict any pressure-induced K-shell delocalisation at all (e.g. OPAL (Rogers et al. 1996) and both BU calculations with the SP and EK models (Röpke et al. 2019)). At lower densities, below the threshold for pressure-induced K-shell delocalisation considered here, the predictions for the average degree of ionisation from three different BU models (Röpke et al. 2019), as well as from other such models as PURGATORIO (Sterne et al. 2007), OPAL (Rogers et al. 1996), and ATOMIC (Hakel et al. 2006), qualitatively agree with our results and predict a decreasing average degree of ionisation with increasing mass density. The Thomas-Fermi (TF) model with a Dirac exchange correction (TFD), along with definitions of ionisation based on its effect on plasma structure (Qs) and on total pressure (Qp) (Clerouin et al. 2022), yields an average degree of ionisation below 4.0 near a mass density of 15 g cm−3. This indicates that the L-shell electrons remain bound to C3+ ions or ions with even lower charge states.
As is well known, EOS is closely related to CSDs and the average degree of ionisation. In Fig. 6, we show pressure as a function of mass density in dense carbon plasmas up to 400 g cm−3 at temperatures of 50, 100, 150, 200, 250, 300, 500, and 800 eV with and without (bi=1) considering the NIC effect on the partition functions of free electrons in the plasmas. A general increase in plasma pressure with rising mass density and temperature is observed across the plasma conditions studied. Notably, a steeper increase in plasma pressure with rising mass density occurs at ~300 g cm−3 for all the temperatures considered here.
This reflects the pressure-induced K-shell delocalisation discussed above. The NIC effect on the partition functions of free electrons exerts less influence on the pressure at lower temperatures (50 and 100 eV) and at the higher temperature of 800 eV, compared to other intermediate temperatures. Furthermore, the NIC effect on pressure becomes negligible at densities above ~300 g cm−3, where the K-shell delocalisation occurs. At a temperature of 300 eV, the pressure can be overestimated by ~10% at densities below ~260 g cm−3 if the NIC effect on the partition functions of free electrons in the plasmas is not included in the calculation.
Figure 7 compares the pressure as a function of mass density predicted by our theory with results from the first principles molecular dynamics (FPMD) method (Clerouin et al. 2022), the QAAM, and the quantum molecular dynamic (QMD) simulations (Faussurier et al. 2021) at a temperature of 100 eV. There is reasonable agreement between our calculated pressure and that from FPMD, QAAM, and QMD below a mass density of 220 g cm−3. Above 220 g cm−3, however, our model predicts a higher pressure than the above methods due to the onset of K-shell delocalisation in C4+ and C5+. For example, at densities above 220 g cm−3, our predicted pressure is 24% higher than that from QMD. Such a significant difference in the EOS of carbon plasma can impact the evolution of white dwarfs, most of which have carbon and oxygen cores, and hot DQ white dwarfs with carbon-dominated atmospheres.
Using the present theoretical formalism, we can better understand the discrepancy between the theoretical and experimental data on the opacity of the dense hydrocarbon (C9H10) (Kritcher et al. 2020). In the experiment, the C9H10 samples were mixed with uniform trace amounts of fluorine (1 at.%). In Fig. 8, we show the opacity of dense C9H10 with 1 at.% fluorine obtained using detailed level accounting (DLA) method, normalised to that of the cold material, at a photon energy of 9 keV and compare it with the experimental results and theoretical data of non-equilibrium modelling using the detailed configuration accounting (DCA) method (Scott & Hansen 2010). Our results show better agreement with the data obtained from experimental measurements (Kritcher et al. 2020) when the NIC effect is properly included in the calculation of ionisation balance.
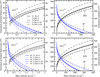 |
Fig. 1 Ionisation potential depressions and IPs as a function of mass density in dense carbon plasmas at plasma temperatures of 50, 200, and 500 eV for the charge states C2+ (a), C3+ (b), C4+ (c), and C5+ (d). For each plot, the left y axis represents the IPDs (black lines), and the right y axis represents the IPs (blue lines). The meaning of the black lines in plot (a) for the IPDs and the blue lines in plot (b) for the IPs applies to all plots (a)–(d) for the charge states C2+, C3+, C4+, and C5+. For comparison, predictions obtained from the SP (Stewart & Pyatt 1966) and EK (Ecker & Kröll 1963) analytical models at a temperature of 200 eV are shown. The legends in plot (a) for the IPDs (black lines) and in plot (b) for the IPs (blue lines) apply for all plots for the charge states of C2+-C5+. |
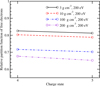 |
Fig. 2 Relative partition functions (bi in the modified Saha equation) of the free electrons for different charge states in dense carbon plasmas at a temperature of 200 eV and the mass densities of 3, 5, 100, and 200 g cm−3. For each plasma condition, the partition functions are scaled relative to that of the uniform electron gas |
![Mathematical equation: $\[\left(Z_{e}=2\left(\frac{2 \pi m_{e} k T}{h^{2}}\right)^{3 / 2}\right)\]$](/articles/aa/full_html/2025/06/aa54609-25/aa54609-25-eq27.png)
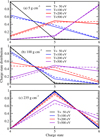 |
Fig. 3 Population fractions of different charge states of dense carbon plasmas at mass densities of 5 (a), 100 (b), and 235 g cm−3 (c), shown for temperatures of 50, 100, 200, and 500 eV. For each plasma density and temperature, solid and dashed lines indicate the results with and without the NIC effect on the partition functions of free electrons, respectively. All other effects, including the IPDs and internal partition functions arising from the plasma environment, are treated identically in both sets of results. |
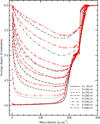 |
Fig. 4 Average degree of ionisation of carbon plasmas as a function of mass density at different plasma temperatures of 50, 100, 150, 200, 250, 300, 500, and 800 eV. Black lines and red lines with circles refer to the average degree of ionisation with and without the NIC effect on the partition functions of free electrons in the plasmas, respectively. |
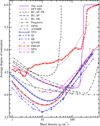 |
Fig. 5 Comparison of the average degree of ionisation of carbon plasmas as a function of mass density at a plasma temperature of 100 eV, predicted by various theoretical methods. Shown are results from DFTMD simulation (black dotted line) (Bethkenhagen et al. 2020); BU calculations (Röpke et al. 2019) incorporating two different IPD models – SP (long black-dashed line) and EK (dotted, short-dashed black line) – and including the PB effects (short-dashed black line); PURGATORIO (dotted, long-dashed black line) (Sterne et al. 2007); OPAL (dot-dot-dashed black line) (Rogers et al. 1996); ATOMIC (dot-dashed-dashed black line) (Hakel et al. 2006); TF and TFD models (Clerouin et al. 2022); Qp and Qs ionisation (Clerouin et al. 2022); QAAM (Faussurier et al. 2021); PMC05 calculation at a temperature of 106 K (Potekhin et al. 2005); and the NPA model (Dharma-wardana 2021). |
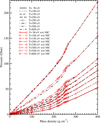 |
Fig. 6 Pressure as a function of mass density in carbon plasmas at different temperatures of 50, 100, 150, 200, 250, 300, 500, and 800 eV with and without considering the NIC effect on the partition functions of free electrons in the plasmas. |
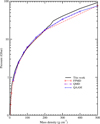 |
Fig. 7 Comparison of pressure as a function of mass density for carbon plasmas at a temperature of 100 eV, as predicted by the FPMD method (Clerouin et al. 2022), the QAAM model, and the QMD simulations (Faussurier et al. 2021). |
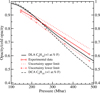 |
Fig. 8 Opacity of dense C9H10 with 1 at.% fluorine (as a tracer element), normalised to that of cold material, at a photon energy of 9 keV as a function of pressure. The NIC effect on the partition functions of free electrons is included in our DLA method. Plasma conditions are determined at the shock front along the shock Hugoniot measured by Kritcher et al. (2020). Experimental and theoretical data from DCA (Kritcher et al. 2020) are shown for comparison. The upper and lower limits of the experimental data indicate the uncertainty contours of ±1σ in the measurement. |
4 Summary and conclusions
Based on the chemical picture of free energy minimisation, the Saha equation approach was modified and extended to apply to an extremely high density plasma regime with pressures of a few 100 Gbar. This allowed for the investigation of the ionisation balance and EOS by properly accounting for NIC effects on free energy, particularly those arising from Coulomb interactions between electrons and ions, and among electrons themselves. The modified equation was then applied to study the ionisation balance and EOS of hot, dense carbon plasmas.
At a temperature of 200 eV, the 2 s electron in C2+ and C3+ is predicted to become delocalised at mass densities of 1.73 and 1.85 g cm−3, respectively, whereas the K-shell delocalisation for C4+ and C5+ occurs at much higher mass densities of 228 and 256 g cm−3. Accurately predicting the critical density for pressure-driven K-shell delocalisation is crucial for determining the average degree of ionisation and EOS. At temperatures below 50 eV, pressure-driven L-shell delocalisation dominates the plasma equilibrium below the density of 220 g cm−3, resulting in an almost constant average degree of ionisation of 4.0 Above that density, pressure-induced K-shell ionisation becomes the dominant process affecting the plasma ionisation balance.
As the plasma temperature increases, a competition arises between pressure-induced K-shell ionisation and thermal ionisation. Which mechanism dominates depends on plasma density and temperature. Below the density threshold for pressure-driven K-shell delocalisation, our predicted average degrees of ionisation for dense carbon plasmas show reasonable agreement with other theoretical models. However, the prediction results show large discrepancies in the critical density at which K-shell electrons become delocalised by pressure. Above ~220 g cm−3, our model generally predicts higher pressure than most other theories, primarily due to the onset of K-shell delocalisation.
Acknowledgements
This work was supported by the National Natural Science Foundation of China under Grants No. 12174343, No. 12274384, and No. 12335015.
References
- Abu-Shawareb, H., Acree, R., Adams, P., et al. 2022, Phys. Rev. Lett., 129, 075001 [Google Scholar]
- Bahcall, J. N., Serenelli, A. M., & Pinsonneault, M. 2004, ApJ, 614, 464 [NASA ADS] [CrossRef] [Google Scholar]
- Basu, S., & Antia, H. M. 2008, Phys. Rep., 457, 217 [Google Scholar]
- Benedict, L. X., Driver, K. P., Hamel, S., et al. 2014, Phys. Rev. B, 89, 224109 [Google Scholar]
- Bethkenhagen, D., Witte, B. B. L, Schörner, M., et al. 2020, Phys. Rev. Res., 2, 023260 [Google Scholar]
- Bethkenhagen, M., Sharma, A., Suryanarayana, P., et al. 2023, Phys. Rev. E, 107, 015306 [Google Scholar]
- Bonitz, M., & Kordts, L. 2025, arXiv e-prints [arXiv:2502.10548v1] [Google Scholar]
- Callow, T. J., Kraisler, E., & Cangi, A. 2023, Phys. Rev. Res., 5, 013049 [Google Scholar]
- Ciricosta, O., Vinko, S. M., Chung, H. K., et al. 2012, Phys. Rev. Lett., 109, 065002 [Google Scholar]
- Ciricosta, O., Vinko, S. M., Barbrel, B., et al. 2016, Nat. Commun., 7, 11713 [Google Scholar]
- Clark, D. S., Haan, S. W., Hammel, B. A., et al. 2010, Phys. Plasmas, 17, 052703 [Google Scholar]
- Clerouin, J., Blanchet, A., Blancard, C., et al. 2022, Phys. Rev. E, 106, 045204 [Google Scholar]
- Davletov, A. E., Arkhipov, Yu V., Mukhametkarimov, Ye S., Yerimbetova, L. T., & Tkachenko, I. M. 2023, New J. Phys., 25, 063019 [Google Scholar]
- Dharma-wardana, M. W. C. 2021, Phys. Rev. E, 104, 015201 [Google Scholar]
- Döppner, T., Swift, D. C., Kritcher, A. L., et al. 2018, Phys. Rev. Lett., 121, 025001 [Google Scholar]
- Döppner, T., Bethkenhagen, M., Kraus, D., et al. 2023, Nature, 618, 270 [Google Scholar]
- Dufour, P., Liebert, J., Fontaine, G., & Behara, N. 2007, Nature, 450, 522 [Google Scholar]
- Ebeling, W., Kraeft, W. D., & Kremp, D. 1977, Theory of Bound States and Ionisation Equilibrium in Plasmas and Solids [Google Scholar]
- Ecker, G., & Kröll, W. 1963, Phys. Fluids, 6, 62 [Google Scholar]
- Faussurier, G., Blancard, C., & Bethkenhagen, M. 2021, Phys. Rev. E, 104, 025209 [Google Scholar]
- Fletcher, L. B., Kritcher, A. L., Pak, A., et al. 2014, Phys. Rev. Lett., 112, 145004 [Google Scholar]
- Fontaine, G., Brassard, P., & Dufour, P. 2008, A&A, 483, L1 [NASA ADS] [CrossRef] [EDP Sciences] [Google Scholar]
- Fu Y. S., Hou, Y., Kang, D. D., et al. 2018, Phys. Plasmas, 25, 012701 [Google Scholar]
- Gawne, T., Vinko, Sam, M., & Wark, J. S. 2024, Phys. Rev. E, 109, L023201 [Google Scholar]
- Giammichele, N., Charpinet, S., Fontaine, G., et al. 2018, Nature, 554, 73 [NASA ADS] [CrossRef] [Google Scholar]
- Graboske, H. C, Harwood, D. J., & Rogers, F. J. 1969, Phys. Rev., 186, 210 [Google Scholar]
- Gu, M. F. 2008, Can. J. Phys., 86, 675 [NASA ADS] [CrossRef] [Google Scholar]
- Hakel, P., Sherill, M. E., Mazevet, S., et al. 2006, J. Quant. Spectrosc. Radiat. Transf., 99, 265 [Google Scholar]
- Hammel, B. A., Haan, S. W., Clark, D. S., et al. 2010, High Energ. Dens. Phys., 6, 171 [Google Scholar]
- Hoarty, D. J., Allan, P., James, S. F., et al. 2014, Phys. Rev. Lett., 110, 265003 [Google Scholar]
- Hollands, M. A., Tremblay, P. E., Gansicke, B. T., et al. 2020, Nat. Astron., 4, 1102 [NASA ADS] [CrossRef] [Google Scholar]
- Hou, Y., Jin, F. T., & Yuan, J. M. 2006, Phys. Plasmas, 13, 093301 [Google Scholar]
- Hou, Y., Bredow, R., Yuan, J. M., & Redmer, R. 2015, Phys. Rev. E, 91, 033114 [Google Scholar]
- Hu, S. X., Collins, L. A., Boehly, T. R., et al. 2018, Phys. Plasmss, 25, 056306 [Google Scholar]
- Huang, Y. H., Liang, Z. H., Zeng, J. L., & Yuan, J. M., 2024, Phys. Rev. E, 109, 045210 [Google Scholar]
- Hurricane, O. A., Patel, P. K., Betti, R., et al. 2023, Rev. Mod. Phys., 95, 025005 [Google Scholar]
- Kraus, D., Chapman, D. A., Kritcher, A. L., et al. 2016, Phys. Rev. E, 94 011202(R) [Google Scholar]
- Kraus, D., Bachmann, B., Barbrel, B., et al. 2019, Plasma Phys. Control. Fusion, 61, 014015 [Google Scholar]
- Kritcher, A. L., Damian, C. S., Doppner, T., et al. 2020, Nature, 584, 51 [Google Scholar]
- Mihalas, D., Däppen, W., & Hummer, D. 1988, ApJ, 331, 815 [NASA ADS] [CrossRef] [Google Scholar]
- Ovechkin, A. A., Loboda, P. A., Popova, V. V., et al. 2023, Phys. Rev. E, 108, 015207 [Google Scholar]
- Potekhin, A. Y., Massacrier, G., & Chabrier, G. 2005, Phys. Rev. E, 72, 046402 [Google Scholar]
- Röpke, G., Blaschke, D., Döppner, T., et al. 2019, Phys. Rev. E, 99, 033201 [Google Scholar]
- Rogers, F. J., Swenson, F. J., & Iglesias, C. A. 1996, ApJ, 456, 902 [Google Scholar]
- Scott, H. A., & Hansen, S. B. 2010, High Energy Density Phys., 6, 39 [Google Scholar]
- Serenelli, A. M., Basu, S., Ferguson, J. W., & Asplund, M. 2009, ApJ, 705, L123 [Google Scholar]
- Son, S.-K., Thiele, R., Jurek, Z., Ziaja, B., & Santra, R. 2014, Phys. Rev. X, 4, 031004 [Google Scholar]
- Starrett, C. E., & Saumon, D. 2012, Phys. Rev. E, 85, 026403 [Google Scholar]
- Sterne, P. A., Hansen, S. B., Wilson, B. G., & Isaacs, W. A. 2007, High Energy Density Phys., 3, 278 [Google Scholar]
- Stewart J. C., & Pyatt, Jr., K. D. 1966, ApJ, 144, 1203 [NASA ADS] [CrossRef] [Google Scholar]
- Winget, D. E., & Kepler, S. O. 2008, Annu. Rev. Astron. Astrophys., 46, 157 [Google Scholar]
- Zeng, J. L., Li, Y. J., Hou, Y., & Yuan, J. M. 2020a, A&A, 644, A92 [NASA ADS] [CrossRef] [EDP Sciences] [Google Scholar]
- Zeng, J. L., Li, Y. J., Gao, C., & Yuan, J. M. 2020b, A&A, 634, A117 [NASA ADS] [CrossRef] [EDP Sciences] [Google Scholar]
- Zeng, J. L., Li, Y. J., Hou, Y., & Yuan, J. M. 2023, Phys. Rev. E, 107, L033201 [Google Scholar]
- Zhang, S., Militzer, B., Benedict, L. X., et al. 2018, J. Chem. Phys., 148, 102318 [Google Scholar]
All Figures
|
Fig. 1 Ionisation potential depressions and IPs as a function of mass density in dense carbon plasmas at plasma temperatures of 50, 200, and 500 eV for the charge states C2+ (a), C3+ (b), C4+ (c), and C5+ (d). For each plot, the left y axis represents the IPDs (black lines), and the right y axis represents the IPs (blue lines). The meaning of the black lines in plot (a) for the IPDs and the blue lines in plot (b) for the IPs applies to all plots (a)–(d) for the charge states C2+, C3+, C4+, and C5+. For comparison, predictions obtained from the SP (Stewart & Pyatt 1966) and EK (Ecker & Kröll 1963) analytical models at a temperature of 200 eV are shown. The legends in plot (a) for the IPDs (black lines) and in plot (b) for the IPs (blue lines) apply for all plots for the charge states of C2+-C5+. |
| In the text | |
|
Fig. 2 Relative partition functions (bi in the modified Saha equation) of the free electrons for different charge states in dense carbon plasmas at a temperature of 200 eV and the mass densities of 3, 5, 100, and 200 g cm−3. For each plasma condition, the partition functions are scaled relative to that of the uniform electron gas |
| In the text | |
|
Fig. 3 Population fractions of different charge states of dense carbon plasmas at mass densities of 5 (a), 100 (b), and 235 g cm−3 (c), shown for temperatures of 50, 100, 200, and 500 eV. For each plasma density and temperature, solid and dashed lines indicate the results with and without the NIC effect on the partition functions of free electrons, respectively. All other effects, including the IPDs and internal partition functions arising from the plasma environment, are treated identically in both sets of results. |
| In the text | |
|
Fig. 4 Average degree of ionisation of carbon plasmas as a function of mass density at different plasma temperatures of 50, 100, 150, 200, 250, 300, 500, and 800 eV. Black lines and red lines with circles refer to the average degree of ionisation with and without the NIC effect on the partition functions of free electrons in the plasmas, respectively. |
| In the text | |
|
Fig. 5 Comparison of the average degree of ionisation of carbon plasmas as a function of mass density at a plasma temperature of 100 eV, predicted by various theoretical methods. Shown are results from DFTMD simulation (black dotted line) (Bethkenhagen et al. 2020); BU calculations (Röpke et al. 2019) incorporating two different IPD models – SP (long black-dashed line) and EK (dotted, short-dashed black line) – and including the PB effects (short-dashed black line); PURGATORIO (dotted, long-dashed black line) (Sterne et al. 2007); OPAL (dot-dot-dashed black line) (Rogers et al. 1996); ATOMIC (dot-dashed-dashed black line) (Hakel et al. 2006); TF and TFD models (Clerouin et al. 2022); Qp and Qs ionisation (Clerouin et al. 2022); QAAM (Faussurier et al. 2021); PMC05 calculation at a temperature of 106 K (Potekhin et al. 2005); and the NPA model (Dharma-wardana 2021). |
| In the text | |
|
Fig. 6 Pressure as a function of mass density in carbon plasmas at different temperatures of 50, 100, 150, 200, 250, 300, 500, and 800 eV with and without considering the NIC effect on the partition functions of free electrons in the plasmas. |
| In the text | |
|
Fig. 7 Comparison of pressure as a function of mass density for carbon plasmas at a temperature of 100 eV, as predicted by the FPMD method (Clerouin et al. 2022), the QAAM model, and the QMD simulations (Faussurier et al. 2021). |
| In the text | |
|
Fig. 8 Opacity of dense C9H10 with 1 at.% fluorine (as a tracer element), normalised to that of cold material, at a photon energy of 9 keV as a function of pressure. The NIC effect on the partition functions of free electrons is included in our DLA method. Plasma conditions are determined at the shock front along the shock Hugoniot measured by Kritcher et al. (2020). Experimental and theoretical data from DCA (Kritcher et al. 2020) are shown for comparison. The upper and lower limits of the experimental data indicate the uncertainty contours of ±1σ in the measurement. |
| In the text | |
Current usage metrics show cumulative count of Article Views (full-text article views including HTML views, PDF and ePub downloads, according to the available data) and Abstracts Views on Vision4Press platform.
Data correspond to usage on the plateform after 2015. The current usage metrics is available 48-96 hours after online publication and is updated daily on week days.
Initial download of the metrics may take a while.