Fig. 1
Download original image
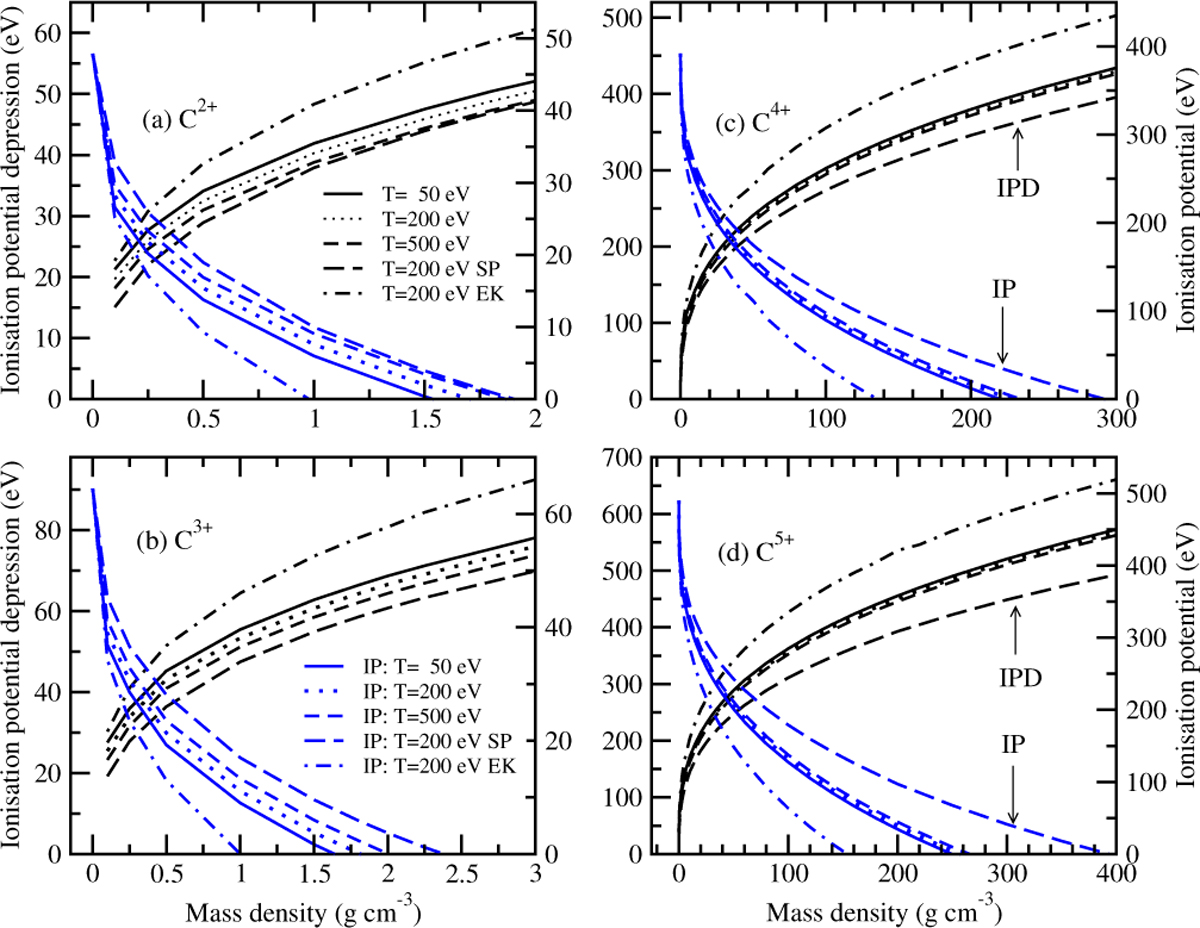
Ionisation potential depressions and IPs as a function of mass density in dense carbon plasmas at plasma temperatures of 50, 200, and 500 eV for the charge states C2+ (a), C3+ (b), C4+ (c), and C5+ (d). For each plot, the left y axis represents the IPDs (black lines), and the right y axis represents the IPs (blue lines). The meaning of the black lines in plot (a) for the IPDs and the blue lines in plot (b) for the IPs applies to all plots (a)–(d) for the charge states C2+, C3+, C4+, and C5+. For comparison, predictions obtained from the SP (Stewart & Pyatt 1966) and EK (Ecker & Kröll 1963) analytical models at a temperature of 200 eV are shown. The legends in plot (a) for the IPDs (black lines) and in plot (b) for the IPs (blue lines) apply for all plots for the charge states of C2+-C5+.
Current usage metrics show cumulative count of Article Views (full-text article views including HTML views, PDF and ePub downloads, according to the available data) and Abstracts Views on Vision4Press platform.
Data correspond to usage on the plateform after 2015. The current usage metrics is available 48-96 hours after online publication and is updated daily on week days.
Initial download of the metrics may take a while.