| Issue |
A&A
Volume 698, June 2025
|
|
|---|---|---|
| Article Number | A181 | |
| Number of page(s) | 8 | |
| Section | Stellar structure and evolution | |
| DOI | https://doi.org/10.1051/0004-6361/202554560 | |
| Published online | 13 June 2025 | |
Revisited parameters for the twin bulge globular clusters NGC 6528 and NGC 6553
1
Università di Padova, Dipartimento di Fisica e Astronomia, Vicolo dell’Osservatorio 2, I-35122 Padova, Italy
2
Centro di Ateneo di Studi e Attività Spaziali “Giuseppe Colombo” – CISAS, Via Venezia 15, 35131 Padova, Italy
3
INAF-Osservatorio di Padova, Vicolo dell’Osservatorio 5, I-35122 Padova, Italy
4
Max Planck Institute for Astronomy, Königstuhl 17, D-69117 Heidelberg, Germany
5
Universidade de São Paulo, IAG, Rua o Matão 1226, Cidade Universitária, São Paulo 05508-900, Brazil
6
Universidade Federal do Rio Grande do Sul, Departamento de Astronomia, CP 15051, Porto Alegre 91501-970, Brazil
⋆ Corresponding author: This email address is being protected from spambots. You need JavaScript enabled to view it.
Received:
16
March
2025
Accepted:
24
April
2025
Abstract
Context. NGC 6528 and NGC 6553 are among the most metal-rich globular clusters in the Galactic bulge. They represent the upper end of the chemical enrichment in the Galaxy, and can increase our understanding of the processes of cluster formation and enrichment.
Aims. Our aim was to refine the fundamental parameters of NGC 6528 and NGC 6553, based on proper motion-corrected Hubble Space Telescope WFC3 and ACS photometries.
Methods. In order to derive the fundamental parameters of age, distance, reddening, and the total-to-selective absorption coefficient, we employed a Bayesian isochrone fitting. Age and metallicity are mainly constrained by the turn-off morphology, thanks to the unprecedented quality of the proper motion-cleaned photometry.
Results. The two clusters show remarkably similar colour-magnitude diagrams. We derived an age of 11±0.5 Gyr with a solar metallicity for both clusters. The reddening for NGC 6528 and NGC 6553 is E(B–V) = 0.63 and 0.76 and the distances from the Sun are d⊙ = 7.85 and 5.1 kpc, respectively; we recall that the distances strictly depend on the adopted total-to-selective absorption parameter.
Conclusions. The age of these metal-rich clusters is about 2 Gyr younger than the moderately metal-poor bulge clusters. The ages and metallicities are remarkably identical to the values of the bulk of bulge field stars.
Key words: Galaxy: bulge / globular clusters: general / globular clusters: individual: NGC 6528 / globular clusters: individual: NGC 6553
© The Authors 2025
 Open Access article, published by EDP Sciences, under the terms of the Creative Commons Attribution License (https://creativecommons.org/licenses/by/4.0), which permits unrestricted use, distribution, and reproduction in any medium, provided the original work is properly cited.
This article is published in open access under the Subscribe to Open model. This email address is being protected from spambots. You need JavaScript enabled to view it. to support open access publication.
1. Introduction
The high metallicity of the globular clusters (GCs) NGC 6528 and NGC 6553 was identified by van den Bergh & Younger (1979) and Hartwick (1975), respectively, from early colour-magnitude diagrams (CMDs). This was further confirmed in integrated light by Zinn (1980), Bica & Pastoriza (1983), Zinn & West (1984), and Armandroff & Zinn (1988). Their high metallicities became clearer with the library of integrated spectra by Bica & Alloin (1986). To accomplish these observations, in order to avoid bright cool M giants that could mask the spectra, the telescope was moved perpendicularly to the slit, and the reduced spectra were then added in right ascension (RA or alpha). From this survey the most metal-rich clusters were found to be NGC 6528, NGC 6553, and NGC 6440. Bica (1988) showed that the spectra of metal-rich clusters were very similar to the spectra of ellipticals and the bulges of spirals.
Other bulge globular clusters appear to have even higher metallicity, such as Terzan 5 and Liller 1. Zinn & West (1984) found [Fe/H] = +0.24 for Terzan 5, confirmed by Ortolani et al. (1996) to show a solar-like metallicity. Later, Frogel et al. (1995) suggested that Liller 1 would be the most metal-rich globular cluster in the Galaxy. Recently, Alvarez Garay et al. (2024) deduced metallicities of [Fe/H] = –0.22 and +0.22 for the two main populations of this cluster. We opted to study NGC 6528 and NGC 6553 further because they have a much lower reddening and lower field contamination than Terzan 5 and Liller 1. In addition, several Hubble Space Telescope (HST) high-resolution images are available in the Space Telescope Science Institute (STScI) archive covering the last 20 years, which allowed us to obtain proper motion estimations, and therefore a cleaned cluster CMD.
Following these identifications, a plethora of studies on NGC 6528 and NGC 6553 as the central object of the work were presented in the literature. Among the most specific works, we can cite Ortolani et al. (1992, 1995), Sagar et al. (1995), Richtler et al. (1998), Davidge (2000), Coelho et al. (2001), Feltzing & Johnson (2002), Momany et al. (2003), Zoccali et al. (2004), Origlia et al. (2005), Lagioia et al. (2014), Calamida et al. (2014), Dias et al. (2015), Liu et al. (2017), and Muñoz et al. (2018) for NGC 6528, and Ortolani et al. (1990), Barbuy et al. (1992, 1999), Demarque & Lee (1992), Sagar et al. (1995, 1999), Guarnieri et al. (1997, 1998), Cohen et al. (1999), Coelho et al. (2001, ), Vallenari & Ortolani (2001), Beaulieu et al. (2001), Zoccali et al. (2001), Origlia et al. (2002), Meléndez et al. (2003), Alves-Brito et al. (2006), Dias et al. (2015), Tang et al. (2017), Muñoz et al. (2020), and Montecinos et al. (2021) for NGC 6553. Additionally, Guillot et al. (2011) identified an X-ray binary and Minniti et al. (2015) identified a black hole candidate in the field of NGC 6553. These two clusters are included in the list of in situ bulge globular clusters by Bica et al. (2016, 2024), and this classification has been confirmed from orbital analyses by Belokurov & Kravtsov (2024) (also see Massari et al. 2019; Pérez-Villegas et al. 2020). Callingham et al. (2022) instead assigns NGC 6553 to Kraken (Kruijssen et al. 2020), and NGC 6528 to the main bulge.
In the present work, we carry out a CMD study of the globular clusters NGC 6528 and NGC 6553. The clusters are projected towards the Galactic bulge, with equatorial coordinates α = 18h10m18.4s, δ=−30o03′20.8″ and Galactic coordinates l, b = 1.14°, –4.17° for NGC 6528, and α = 18h09m15.68s, δ=−25o54′27.9″, and l, b = 5.25°, –3.02° (Harris 1996, 2010 edition) for NGC 6553. NGC 6528 is in Baade's Window.
In Sect. 2 the observations and data reduction are described. In Sect. 3 the parameters from the literature are reviewed, and isochrone fitting is applied to CMDs and described. Chemical abundances are discussed in Sect. 4. Our concluding remarks are given in Sect. 5.
2. Observations and data reduction
For this work we used HST observations of the two globular clusters NGC 6528 and NGC 6553. For NGC 6528 we analysed images in ACS/WFC F606W and F814W filters collected during GO-9453 (PI: Brown, epoch: 2002.60; Brown 2002), and in WFC3/UVIS F390W, F555W, and F814W filters obtained during GO-11664 (PI: Brown, epoch: 2010.55; Brown et al. 2010). For NGC 6553, we used ACS/WFC images collected during GO-10573 (PI: Mateo, epoch: 2006.26; Mateo 2005) in F435W, F555W, and F814W filters, WFC3/UVIS data in F555W and F814W filters during GO-15232 (PI: Ferraro, epoch: 2017.81; Ferraro 2017), and WFC3/IR images in F110W and F160W obtained during GO-16282 (PI: Correnti, epoch: 2020.81; Correnti et al. 2020). A log of the observations is reported in Table A.1.
For the data reduction and the extraction of astro-photometric catalogues of the two clusters, we followed the procedure adopted by Nardiello et al. (2018a) and Nardiello et al. (2018b). First, we extracted astro-photometric catalogues of each image by using the software hst1pass (first-pass photometry, Anderson 2022), which makes use of a library of perturbed Point Spread Functions (PSFs) to fit the positions and magnitude of the stars in the images. For each filter, six parameter transformations were used to match the positions of the stars measured in each image, while linear photometric transformations were used to transform the magnitudes of the stars measured in each image to a common reference system; we adopted the longest exposure image as reference. We combined all the transformations to obtain a first-guess single catalogue that contains averaged positions and fluxes calculated in a defined reference system. We used perturbed PSFs, transformations, and images to carry on the second-pass photometry with KS2 (Anderson et al. 2008). This software performs a simultaneous analysis of all the images to extract precise positions and fluxes of all the stars detectable in the field through different iterations. In each iteration it subtracts the stars already measured and searches for fainter stars. The output of the KS2 is a catalogue with mean positions, fluxes, errors on the fluxes, quality-of-fit parameters, and sharp parameters. These parameters were used to reject bad measurements, as was done in Scalco et al. (2021). Moreover, single catalogues associated with each image in which the positions and fluxes of the stars measured in each single image are also available. We used them to compute the proper motions between the two epochs following the method presented in Libralato et al. (2021). This method is based on the use of a local network of bona fide cluster members to compute the mean displacements of the stars between two epochs. For each star in the catalogue, the software searches for bona fide members in the neighbourhood (usually between 20 and 50 stars) and calculates the mean displacement between the first and second epoch. Because as reference we adopted the stars in the cluster, the cluster members are centred at (0,0) in the vector-point diagram.
We corrected the CMDs for differential reddening following the procedure adopted by Milone et al. (2012). Briefly, we selected those with the highest probability of being a cluster member on the basis of their position on the CMD and their proper motions. For each star in the catalogue we selected from this sample the 50 closest cluster stars and measured the mean difference between their colour and the fiducial cluster sequence along the reddening direction. We assumed this mean value as an estimate of the local differential reddening.
3. Colour-magnitude diagrams and isochrone fitting
In Table 1 we report the literature ages, reddening E(B–V), distances, and metallicities for the two sample clusters. A more recent review on the distances is presented by Baumgardt & Vasiliev (2021), where distances of 7.8 and 5.3 kpc for the clusters are given, obtained by averaging the results from optical, near-infrared (NIR), and Gaia EDR3 (Gaia Collaboration 2021).
Literature reddening, ages, distances, and metallicities for NGC 6528 and NGC 6553.
The fundamental parameters of age, metallicity, distance, reddening, and total-to-selective extinction ratio (RV) were derived using the SIRIUS code (Souza et al. 2020, 2024). The code employs the Bayesian Markov chain Monte Carlo (McMC) method to obtain probability distributions for each parameter by comparing the observed CMDs with synthetic CMDs built from each set of parameters randomly drawn during the fitting process. The McMC was applied using the Python library, emcee (Foreman-Mackey et al. 2013), and PyDE1, a global optimisation that uses differential evolution.
In order to build the synthetic diagrams, the SIRIUS code uses the PAdova and TRieste Stellar Evolution Code (PARSEC)2 Bressan et al. (2012). The parameter space spans ages between 7 Gyr and 14 Gyr with intervals of 0.1 Gyr, and metallicities between −2.0 and +0.3 with intervals of 0.05 dex. The code then interpolates the isochrone grid to obtain the model for each McMC realisation. We assume the initial mass function from Kroupa (2001). All the details on how the code constructs the synthetic population can be found in Souza et al. (2024). Briefly, the synthetic CMDs are constructed by drawing stellar masses from the IMF and by interpolating the corresponding magnitudes from the PARSEC isochrone grid according to the parameters selected at each McMC step. A fraction of these stars are treated as unresolved binaries; the secondary components are assigned using a randomly selected mass ratio, and their combined magnitudes are computed by summing their fluxes. To simulate observational uncertainties, a magnitude-dependent error function derived from the observed photometric errors is applied, anchored to the position of the turn-off to preserve alignment with the observed CMD. The extinction correction is computed at each iteration using the adopted RV value and extinction coefficients interpolated from the extinction law of Cardelli et al. (1989). Finally, a luminosity function is applied to the synthetic sample to reproduce the observed distribution of stars in magnitude space.
The RV value is determined by fitting simultaneously at least two different CMDs for the same cluster. Usually, one CMD is composed of NIR filters to reduce the effect of reddening. This approach was first applied by Pallanca et al. (2021) and by Souza et al. (2021, 2023), and implemented as simultaneous isochrone fitting by Souza et al. (2024). To improve the age determination, we give more weight to the turn-off (TO) region since the high-quality data give us a narrow and distinct shape of the TO, which is the most important feature to be fitted.
Although the SIRIUS code provides a robust statistical framework for deriving cluster parameters, several sources of systematic uncertainty remain. The adoption of a specific stellar evolutionary model incorporates assumptions about stellar physics, such as convective overshooting, mass loss, and the treatment of advanced evolutionary stages. These assumptions can lead to model-dependent biases in the recovered parameters, particularly age and metallicity (see an example for the GC HP1 in Kerber et al. 2019). The adoption of a fixed initial mass function from Kroupa (2001) also contributes to systematic uncertainty, especially in systems that may have experienced dynamical evolution or mass segregation. Nevertheless, the assumption of an IMF does not have an impact on our parameter derivation, given that the fitting is performed with more weight in the main sequence turn-off (MSTO). Additional systematics on the extinction and RV estimates could be introduced by any residual zero-point offsets, colour terms, or spatial variations in reddening. Therefore, we note that the parameter uncertainties presented in this work and provided by the SIRIUS code must be assumed as internal errors of the Bayesian method.
The two proper motion-cleaned CMDs are shown in Fig. 1 for the clusters, with the F555W and F814W filters of the WFC3 camera. It is important to note that the proper motion detection promoted a very efficient cleaning from field stars (masking of field stars). In particular NGC 6553 has a significant proper motion leading to most of the cluster stars cleaned from the bulk of the field population. In Fig. 2 the mean loci corresponding to the CMDs shown in Fig. 1 are compared. We note the striking similarity between them, despite the different number of stars. The resulting cleaned CMDs supersede those of the previous literature thanks to the wide time base between the first and the second epoch (about 14 years).
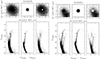 |
Fig. 1. Original and proper motion-cleaned CMDs in F814W vs. F555W = –F814W for NGC 6528 and NGC 6553. For both clusters the left panel is the original photometry; the middle panel is the proper motion-cleaned photometry; and the right panel is the field. |
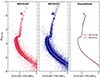 |
Fig. 2. Comparison of the CMDs of the GCs NGC 6528 and NGC 6553. The left and middle panels show the CMDs of NGC 6528 (red) and NGC 6553 (blue), respectively, with their corresponding fiducial lines overplotted in white. The right panel directly compares the fiducial lines of both clusters; NGC 6528 is shown as a red solid line and NGC 6553 as a blue dashed line. The similarity between the fiducial lines highlights the close resemblance of the stellar populations. |
In Fig. 3 are presented the F814W versus F555W-F160W and F814W versus F814W-F160W CMDs for NGC 6553. The choice of optical combined with infrared filters was adopted to have a wide wavelength range; two combinations of colour allowed us to derive the reddening law parameter RV. The resulting fit yields an age of 11.1±0.5 Gyr, a reddening of E(B-V) = 0.78±0.04, and a distance from the Sun of d⊙ = 5.14±0.09 kpc, with RV = 3.0±0.1. The derived distance is in good agreement with Baumgardt & Vasiliev (2021), just at the lower edge of their average error bar, and also compatible with the Gaia parallaxes error bar. This is also in agreement with most of the literature (Table 1).
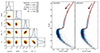 |
Fig. 3. Isochrone fitting result for NGC 6553. Left: Corner plot displaying the posterior probability distributions of the fundamental parameters obtained from isochrone fitting. The 1D marginalised distributions along the diagonal show the median values (solid lines) and the 16th–84th percentile ranges (dashed lines), while the 2D contour plots depict the covariances between parameters. The best-fit values with uncertainties are listed in the upper right corner. Right: Observed CMDs in the HST filters: F814W vs. F390W–F814W (left panel) and F814W vs. F555W–F814W (right panel). The CMDs are coloured by density. The best-fit isochrone, derived from the MCMC analysis, is overlaid in red. The isochrone accurately reproduces the main sequence, subgiant branch, and red giant branch, thus validating the derived cluster parameters. |
The total-to-selective absorption parameter RV = 2.9 is somewhat lower than the standard value of 3.1, which is compatible with the location of the cluster at about 4° below the Galactic plane. The metallicity of [M/H] = −0.07 is compatible with most of the literature giving [Fe/H] ≈ −0.2 and alpha-enhancement around [α/Fe] = +0.2. The age of 11.1 Gyr is lower than the literature ages, and this is explained by the fact that previous estimations were based on comparisons with the halo globular cluster NGC104 (47 Tuc). It appears now from the present data that 47 Tuc has an age of 11.5 Gyr (Gerasimov et al. 2024).
In Fig. 4 are given the F814W versus F390W-F814W and F814W versus F555W-F814W CMDs for NGC 6528. It is clear that the metallicity [M/H] = −0.10 and age of 11.04 Gyr of this cluster are very similar to those of NGC 6553, as expected. The reddening E(B-V) = 0.63 is similar to other literature values. The distance from the Sun depends on the assumed RV value. The study of Saha et al. (2019), based on RR Lyrae stars, indicate that the reddening parameter RV could be lower in Baade's Window, in particular including NGC 6528, relative to the study by Fitzpatrick (1999). Since we do not have a wavelength range large enough to constrain the reddening law, we adopted a conservative value of RV = 3.0 as a prior in the isochrone fitting. The resulting distance from the Sun is d⊙ = 7.85±0.12 kpc.
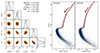 |
Fig. 4. Same as Fig. 3, but for NGC 6528 and CMDs in F814W vs. F390W–F814W (middle) and F814W vs. F555W–F814W (right). |
Therefore, these metal-rich clusters appear to be different from the moderately metal-poor clusters NGC 6522, NGC 6558, HP 1, AL 3, among others, that are as old as 13 Gyr; see Table 3 from Souza et al. (2024).
The age and metallicity obtained from NGC 6553 and NGC 6528 are remarkably similar to those found from the sample of field stars in the Sagittarius Window field in the Galactic bulge by Clarkson et al. (2008) from a proper motion HST cleaned sample. They found that the bulk of the field population shows a best age from isochrone turn-off fitting of 11 Gyr with a solar metallicity. The similarity of the two clusters with the Baade's Window field was also presented by Ortolani et al. (1995). These results reinforce the idea that these clusters are genuine representatives of the bulk of the bulge field stellar population, and this result give a tighter constraint on the age and age-metallicity relation of the Galactic bulge population.
4. Chemical abundances
In Table 2 are reported the mean value element abundances from the literature. It should be noted that in Schiavon et al. (2017, 2024) the high abundances of N and Na in part of the stars indicate that they correspond to second-generation (2G) stars, and those that are N- and Na-normal should be first-generation (1G) stars. For this reason, we only took into account the stars with low N abundances, which should be 1G stars. A particularly important result is the Al abundance, which is relatively high in all the stars, pointing to an in situ origin of this cluster, and therefore not identified with the Kraken structure (Kruijssen et al. 2020), and contradicting Callingham et al. (2022). In fact, all ex situ objects show low Al. In Fig. 5 are shown indicators of the in situ or ex situ origin of the clusters: [Mg/Mn] versus [Al/Fe] (left panel) indicates that the two clusters are found in the locus of in situ objects (Helmi et al. 2018; Limberg et al. 2022; Souza et al. 2023); [Ni/Fe] versus [(C+N)/O] show nickle-to-iron abundances higher than solar, again indicating an in situ origin according to Nissen & Schuster (2010) (see also Barbuy et al. 2024); and [N/Fe] versus [Na/Fe] indicating that the selected stars are N- and Na-poor, and are therefore 1G stars.
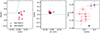 |
Fig. 5. [Mg/Mn] vs. [Al.Fe] (left panel), [Ni/Fe] vs. [(C+N)/O] (middle panel), indicating in situ origin for the clusters, and [N/Fe] vs. [Na/Fe] (right panel), indicating that the stars selected are low N and low Na. |
Mean abundance ratios for the sample clusters.
The multiple stellar populations in the two sample clusters were made evident from photometric data from the Blanco DECam survey of the Galactic bulge by Kader et al. (2022), with approximately one-half of the stars as 1G and half as 2G. As noted above, this is in agreement with the relevant element abundances.
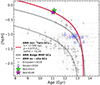 |
Fig. 6. Age-metallicity relation (AMR) for the twin GCs. The red solid curve represents the AMR including the twin GCs, with a formation time of tf = 13.5 Gyr, effective yields ρ = 0.077Z⊙, and [α/Fe]=+0.20. The black solid and dashed curves represent the AMR respectively for in situ and ex situ bulge metal-poor GCs. The open circles indicate the data from Kruijssen et al. (2019), while the blue triangles show the old moderately metal-poor clusters already presented in Souza et al. (2024) for the metal-poor bulge GCs. The green and purple stars mark the positions of NGC 6553 and NGC 6528, respectively, and highlight their consistency with the AMR trend. |
The theoretical age-metallicity relation (AMR) was obtained assuming a closed box and instantaneous recycling approximation (IRA). This approach is often used in the literature as a simple approximation of the in situ and ex situ branches (e.g. Massari et al. 2019; Forbes 2020; Souza et al. 2024). The two GCs add an important constraint to the bulge AMR. The AMR fitting resulted in a star formation starting 13.5 Gyr and an effective yield of 0.077 Z⊙. Compared to the values obtained in Souza et al. (2024) for the moderately metal-poor bulge GCs (MMPGCs), the values obtained in this work agree with the previous determination showing that the twin GCs improve the understanding of the formation and origin of the bulge GCs population since they fix the high end of the metallicity distribution function.
5. Concluding remarks
We have carried out a photometric analysis of proper motion-cleaned and differential reddening corrected colour-magnitude diagrams for NGC 6528 and NGC 6553. These much improved data supersede previous data, and in principle the analysis is more reliable than previous analyses, mainly because of the wide time interval between the observations used for the proper motion cleaning.
We obtain ages of 11.04 and 11.1 Gyr for NGC 6528 and NGC 6553, and a solar metallicity for both. The striking similarity of the two clusters in terms of age and metallicity is unique among bulge globular clusters in spite of their different locations and different total mass and concentration (e.g. Trager et al. 1995).
For NGC 6553, the use of simultaneous fitting with different wavelength baselines allowed us to fix the total-to-selective absorption RV = 2.9, and therefore with a reliable distance from the Sun of 5.14 kpc. For NGC 6528 we adopted a conservative total-to-selective absorption parameter RV = 3.0, and obtained a distance from the Sun of 7.85 kpc.
These two metal-rich clusters are different from the moderately metal-poor bulge clusters, that are older by about 2 Gyr. These combined studies allow us to define an age-metallicity relation for the Galactic bulge.
Acknowledgments
SO acknowledges the support of the University of Padova, DOR Ortolani 2020, Piotto 2021 and Piotto 2022, Italy and funded by the European Union – NextGenerationEU” RRF M4C2 1.1 n: 2022HY2NSX. “CHRONOS: adjusting the clock(s) to unveil the CHRONO-chemo-dynamical Structure of the Galaxy” (PI: S. Cassisi). SOS acknowledges the DGAPA-PAPIIT grant IA103224 and the support from Dr. Nadine Neumayer's Lise Meitner grant from the Max Planck Society. BB and EB acknowledge partial financial support from FAPESP, CNPq and CAPES – Financial code 001. This research is based on observations made with the NASA/ESA Hubble Space Telescope obtained from the Space Telescope Science Institute, which is operated by the Association of Universities for Research in Astronomy, Inc., under NASA contract NAS 5-26555. The HST observations are associated with programmes GO-9453 (PI: Brown), GO-11664 (PI: Brown), GO-10573 (PI: Mateo), GO-15232 (PI: Ferraro), GO-16282 (PI: Correnti).
Version 3.8, https://stev.oapd.inaf.it/cgi-bin/cmd_3.8
References
- Alvarez Garay, D. A., Fanelli, C., Origlia, L., et al. 2024, A&A, 686, A198 [NASA ADS] [CrossRef] [EDP Sciences] [Google Scholar]
- Alves-Brito, A., Barbuy, B., Zoccali, M., et al. 2006, A&A, 460, 269 [NASA ADS] [CrossRef] [EDP Sciences] [Google Scholar]
- Anderson, J. 2022, One-Pass HST Photometry with hst1pass, Instrument Science Report WFC3 2022–5, 55 [Google Scholar]
- Anderson, J., King, I. R., Richer, H. B., et al. 2008, AJ, 135, 2114 [NASA ADS] [CrossRef] [Google Scholar]
- Armandroff, T. E., & Zinn, R. 1988, AJ, 96, 92 [Google Scholar]
- Barbuy, B., Castro, S., Ortolani, S., & Bica, E. 1992, A&A, 259, 607 [NASA ADS] [Google Scholar]
- Barbuy, B., Renzini, A., Ortolani, S., Bica, E., & Guarnieri, M. D. 1999, A&A, 341, 539 [NASA ADS] [Google Scholar]
- Barbuy, B., Friaça, A. C. S., Ernandes, H., et al. 2024, A&A, 691, A296 [NASA ADS] [CrossRef] [EDP Sciences] [Google Scholar]
- Baumgardt, H., & Vasiliev, E. 2021, MNRAS, 505, 5957 [NASA ADS] [CrossRef] [Google Scholar]
- Beaulieu, S. F., Gilmore, G., Elson, R. A. W., et al. 2001, AJ, 121, 2618 [Google Scholar]
- Belokurov, V., & Kravtsov, A. 2024, MNRAS, 528, 3198 [CrossRef] [Google Scholar]
- Bica, E. 1988, A&A, 195, 76 [NASA ADS] [Google Scholar]
- Bica, E., & Alloin, D. 1986, A&A, 162, 21 [NASA ADS] [Google Scholar]
- Bica, E. L. D., & Pastoriza, M. G. 1983, Ap&SS, 91, 99 [Google Scholar]
- Bica, E., Ortolani, S., & Barbuy, B. 2016, PASA, 33 [CrossRef] [Google Scholar]
- Bica, E., Ortolani, S., Barbuy, B., & Oliveira, R. A. P. 2024, A&A, 687, A201 [NASA ADS] [CrossRef] [EDP Sciences] [Google Scholar]
- Bressan, A., Marigo, P., Girardi, L., et al. 2012, MNRAS, 427, 127 [NASA ADS] [CrossRef] [Google Scholar]
- Brown, T. 2002, Guide Star Test for program 9453, HST Proposal ID 9695. Cycle, 11 [Google Scholar]
- Brown, T. M., Sahu, K., Anderson, J., et al. 2010, ApJ, 725, L19 [NASA ADS] [CrossRef] [Google Scholar]
- Calamida, A., Bono, G., Lagioia, E. P., et al. 2014, A&A, 565, A8 [Google Scholar]
- Callingham, T. M., Cautun, M., Deason, A. J., et al. 2022, MNRAS, 513, 4107 [NASA ADS] [CrossRef] [Google Scholar]
- Cardelli, J. A., Clayton, G. C., & Mathis, J. S. 1989, ApJ, 345, 245 [Google Scholar]
- Carretta, E., Cohen, J. G., Gratton, R. G., & Behr, B. B. 2001, AJ, 122, 1469 [NASA ADS] [CrossRef] [Google Scholar]
- Clarkson, W., Sahu, K., Anderson, J., et al. 2008, ApJ, 684, 1110 [NASA ADS] [CrossRef] [Google Scholar]
- Coelho, P., Barbuy, B., Perrin, M. N., et al. 2001, A&A, 376, 136 [NASA ADS] [CrossRef] [EDP Sciences] [Google Scholar]
- Cohen, J. G., Gratton, R. G., Behr, B. B., & Carretta, E. 1999, ApJ, 523, 739 [Google Scholar]
- Correnti, M., Brown, T. M., Cohen, R., Gennaro, M., & Kalirai, J. 2020, The IR CMD of the Metal-Rich Bulge Cluster NGC6553: Pushing its Age to Sub-Gyr Precision, HST Proposal Cycle 28 ID. #16282 [Google Scholar]
- Davidge, T. J. 2000, ApJS, 126, 105 [Google Scholar]
- Demarque, P., & Lee, Y. W. 1992, A&A, 265, 40 [Google Scholar]
- Dias, B., Barbuy, B., Saviane, I., et al. 2015, A&A, 573, A13 [NASA ADS] [CrossRef] [EDP Sciences] [Google Scholar]
- Feltzing, S., & Johnson, R. A. 2002, A&A, 385, 67 [NASA ADS] [CrossRef] [EDP Sciences] [Google Scholar]
- Ferraro, F. 2017, Pushing ahead the frontier of the Globular Cluster dynamics: the 3D view of the velocity space, HST Proposal id.15232. Cycle 25 [Google Scholar]
- Fitzpatrick, E. L. 1999, PASP, 111, 63 [Google Scholar]
- Forbes, D. A. 2020, MNRAS, 493, 847 [Google Scholar]
- Foreman-Mackey, D., Hogg, D. W., Lang, D., & Goodman, J. 2013, PASP, 125, 306 [Google Scholar]
- Frogel, J. A., Kuchinski, L. E., & Tiede, G. P. 1995, AJ, 109, 1154 [NASA ADS] [CrossRef] [Google Scholar]
- Gaia Collaboration (Brown, A. G. A., et al.) 2021, A&A, 649, A1 [NASA ADS] [CrossRef] [EDP Sciences] [Google Scholar]
- Gerasimov, R., Burgasser, A. J., Caiazzo, I., et al. 2024, ApJ, 961, 139 [NASA ADS] [CrossRef] [Google Scholar]
- Guarnieri, M. D., Renzini, A., & Ortolani, S. 1997, ApJ, 477, L21 [Google Scholar]
- Guarnieri, M. D., Ortolani, S., Montegriffo, P., et al. 1998, A&A, 331, 70 [NASA ADS] [Google Scholar]
- Guillot, S., Rutledge, R. E., Brown, E. F., Pavlov, G. G., & Zavlin, V. E. 2011, ApJ, 738, 129 [Google Scholar]
- Harris, W. E. 1996, AJ, 112, 1487 [Google Scholar]
- Hartwick, F. D. A. 1975, PASP, 87, 77 [Google Scholar]
- Heitsch, F., & Richtler, T. 1999, A&A, 347, 455 [NASA ADS] [Google Scholar]
- Helmi, A., Babusiaux, C., Koppelman, H. H., et al. 2018, Nature, 563, 85 [Google Scholar]
- Kader, J. A., Pilachowski, C. A., Johnson, C. I., et al. 2022, ApJ, 940, 76 [NASA ADS] [CrossRef] [Google Scholar]
- Kerber, L. O., Libralato, M., Souza, S. O., et al. 2019, MNRAS, 484, 5530 [Google Scholar]
- Kroupa, P. 2001, MNRAS, 322, 231 [NASA ADS] [CrossRef] [Google Scholar]
- Kruijssen, J. M. D., Pfeffer, J. L., Reina-Campos, M., Crain, R. A., & Bastian, N. 2019, MNRAS, 486, 3180 [Google Scholar]
- Kruijssen, J. M. D., Pfeffer, J. L., Chevance, M., et al. 2020, MNRAS, 498, 2472 [NASA ADS] [CrossRef] [Google Scholar]
- Lagioia, E. P., Milone, A. P., Stetson, P. B., et al. 2014, ApJ, 782, 50 [Google Scholar]
- Libralato, M., Lennon, D. J., Bellini, A., et al. 2021, MNRAS, 500, 3213 [Google Scholar]
- Limberg, G., Souza, S. O., Pérez-Villegas, A., et al. 2022, ApJ, 935, 109 [NASA ADS] [CrossRef] [Google Scholar]
- Liu, C., Ruchti, G., Feltzing, S., & Primas, F. 2017, A&A, 601, A31 [NASA ADS] [CrossRef] [EDP Sciences] [Google Scholar]
- Massari, D., Koppelman, H. H., & Helmi, A. 2019, A&A, 630, L4 [NASA ADS] [CrossRef] [EDP Sciences] [Google Scholar]
- Mateo, M. 2005, Globular Clusters in the Direction of the Inner Galaxy, HST Proposal ID 10573. Cycle 14 [Google Scholar]
- Meléndez, J., Barbuy, B., Bica, E., et al. 2003, A&A, 411, 417 [NASA ADS] [CrossRef] [EDP Sciences] [Google Scholar]
- Milone, A. P., Marino, A. F., Cassisi, S., et al. 2012, ApJ, 754, L34 [NASA ADS] [CrossRef] [Google Scholar]
- Minniti, D., Contreras Ramos, R., Alonso-García, J., et al. 2015, ApJ, 810, L20 [Google Scholar]
- Momany, Y., Ortolani, S., Held, E. V., et al. 2003, A&A, 402, 607 [NASA ADS] [CrossRef] [EDP Sciences] [Google Scholar]
- Montecinos, C., Villanova, S., Muñoz, C., & Cortés, C. C. 2021, MNRAS, 503, 4336 [NASA ADS] [CrossRef] [Google Scholar]
- Muñoz, C., Geisler, D., Villanova, S., et al. 2018, A&A, 620, A96 [Google Scholar]
- Muñoz, C., Villanova, S., Geisler, D., et al. 2020, MNRAS, 492, 3742 [CrossRef] [Google Scholar]
- Nardiello, D., Libralato, M., Piotto, G., et al. 2018a, MNRAS, 481, 3382 [NASA ADS] [CrossRef] [Google Scholar]
- Nardiello, D., Milone, A. P., Piotto, G., et al. 2018b, MNRAS, 477, 2004 [NASA ADS] [CrossRef] [Google Scholar]
- Nissen, P. E., & Schuster, W. J. 2010, A&A, 511, L10 [NASA ADS] [CrossRef] [EDP Sciences] [Google Scholar]
- Origlia, L., Rich, R. M., & Castro, S. 2002, AJ, 123, 1559 [Google Scholar]
- Origlia, L., Valenti, E., & Rich, R. M. 2005, MNRAS, 356, 1276 [NASA ADS] [CrossRef] [Google Scholar]
- Ortolani, S., Barbuy, B., & Bica, E. 1990, A&A, 236, 362 [NASA ADS] [Google Scholar]
- Ortolani, S., Bica, E., & Barbuy, B. 1992, A&AS, 92, 441 [NASA ADS] [Google Scholar]
- Ortolani, S., Renzini, A., Gilmozzi, R., et al. 1995, Nature, 377, 701 [CrossRef] [Google Scholar]
- Ortolani, S., Barbuy, B., & Bica, E. 1996, A&A, 308, 733 [NASA ADS] [Google Scholar]
- Pallanca, C., Lanzoni, B., Ferraro, F. R., et al. 2021, ApJ, 913, 137 [NASA ADS] [CrossRef] [Google Scholar]
- Pérez-Villegas, A., Barbuy, B., Kerber, L. O., et al. 2020, MNRAS, 491, 3251 [Google Scholar]
- Richtler, T., Grebel, E. K., Subramaniam, A., & Sagar, R. 1998, A&AS, 127, 167 [NASA ADS] [CrossRef] [EDP Sciences] [Google Scholar]
- Sagar, R., Subramaniam, A., Richtler, T., & Grebel, E. K. 1995, Bull. Astron. Soc. India, 23, 449 [Google Scholar]
- Sagar, R., Subramaniam, A., Richtler, T., & Grebel, E. K. 1999, A&AS, 135, 391 [NASA ADS] [CrossRef] [EDP Sciences] [Google Scholar]
- Saha, A., Vivas, A. K., Olszewski, E. W., et al. 2019, ApJ, 874, 30 [NASA ADS] [CrossRef] [Google Scholar]
- Scalco, M., Bellini, A., Bedin, L. R., et al. 2021, MNRAS, 505, 3549 [NASA ADS] [CrossRef] [Google Scholar]
- Schiavon, R. P., Johnson, J. A., Frinchaboy, P. M., et al. 2017, MNRAS, 466, 1010 [NASA ADS] [CrossRef] [Google Scholar]
- Schiavon, R. P., Phillips, S. G., Myers, N., et al. 2024, MNRAS, 528, 1393 [CrossRef] [Google Scholar]
- Souza, S. O., Kerber, L. O., Barbuy, B., et al. 2020, ApJ, 890, 38 [Google Scholar]
- Souza, S. O., Valentini, M., Barbuy, B., et al. 2021, A&A, 656, A78 [NASA ADS] [CrossRef] [EDP Sciences] [Google Scholar]
- Souza, S. O., Ernandes, H., Valentini, M., et al. 2023, A&A, 671, A45 [NASA ADS] [CrossRef] [EDP Sciences] [Google Scholar]
- Souza, S. O., Libralato, M., Nardiello, D., et al. 2024, A&A, 690, A37 [NASA ADS] [CrossRef] [EDP Sciences] [Google Scholar]
- Tang, B., Cohen, R. E., Geisler, D., et al. 2017, MNRAS, 465, 19 [NASA ADS] [CrossRef] [Google Scholar]
- Trager, S. C., King, I. R., & Djorgovski, S. 1995, AJ, 109, 218 [NASA ADS] [CrossRef] [Google Scholar]
- Vallenari, A., & Ortolani, S. 2001, A&A, 380, L35 [NASA ADS] [CrossRef] [EDP Sciences] [Google Scholar]
- van den Bergh, S., & Younger, F. 1979, AJ, 84, 1305 [Google Scholar]
- Zinn, R. 1980, ApJS, 42, 19 [Google Scholar]
- Zinn, R., & West, M. J. 1984, ApJS, 55, 45 [Google Scholar]
- Zoccali, M., Renzini, A., Ortolani, S., Bica, E., & Barbuy, B. 2001, AJ, 121, 2638 [Google Scholar]
- Zoccali, M., Barbuy, B., Hill, V., et al. 2004, A&A, 423, 507 [NASA ADS] [CrossRef] [EDP Sciences] [Google Scholar]
Appendix A: Log of observations
The log of observations is given in Table A.1.
Log of HST observations.
All Tables
Literature reddening, ages, distances, and metallicities for NGC 6528 and NGC 6553.
All Figures
|
Fig. 1. Original and proper motion-cleaned CMDs in F814W vs. F555W = –F814W for NGC 6528 and NGC 6553. For both clusters the left panel is the original photometry; the middle panel is the proper motion-cleaned photometry; and the right panel is the field. |
| In the text | |
|
Fig. 2. Comparison of the CMDs of the GCs NGC 6528 and NGC 6553. The left and middle panels show the CMDs of NGC 6528 (red) and NGC 6553 (blue), respectively, with their corresponding fiducial lines overplotted in white. The right panel directly compares the fiducial lines of both clusters; NGC 6528 is shown as a red solid line and NGC 6553 as a blue dashed line. The similarity between the fiducial lines highlights the close resemblance of the stellar populations. |
| In the text | |
|
Fig. 3. Isochrone fitting result for NGC 6553. Left: Corner plot displaying the posterior probability distributions of the fundamental parameters obtained from isochrone fitting. The 1D marginalised distributions along the diagonal show the median values (solid lines) and the 16th–84th percentile ranges (dashed lines), while the 2D contour plots depict the covariances between parameters. The best-fit values with uncertainties are listed in the upper right corner. Right: Observed CMDs in the HST filters: F814W vs. F390W–F814W (left panel) and F814W vs. F555W–F814W (right panel). The CMDs are coloured by density. The best-fit isochrone, derived from the MCMC analysis, is overlaid in red. The isochrone accurately reproduces the main sequence, subgiant branch, and red giant branch, thus validating the derived cluster parameters. |
| In the text | |
|
Fig. 4. Same as Fig. 3, but for NGC 6528 and CMDs in F814W vs. F390W–F814W (middle) and F814W vs. F555W–F814W (right). |
| In the text | |
|
Fig. 5. [Mg/Mn] vs. [Al.Fe] (left panel), [Ni/Fe] vs. [(C+N)/O] (middle panel), indicating in situ origin for the clusters, and [N/Fe] vs. [Na/Fe] (right panel), indicating that the stars selected are low N and low Na. |
| In the text | |
|
Fig. 6. Age-metallicity relation (AMR) for the twin GCs. The red solid curve represents the AMR including the twin GCs, with a formation time of tf = 13.5 Gyr, effective yields ρ = 0.077Z⊙, and [α/Fe]=+0.20. The black solid and dashed curves represent the AMR respectively for in situ and ex situ bulge metal-poor GCs. The open circles indicate the data from Kruijssen et al. (2019), while the blue triangles show the old moderately metal-poor clusters already presented in Souza et al. (2024) for the metal-poor bulge GCs. The green and purple stars mark the positions of NGC 6553 and NGC 6528, respectively, and highlight their consistency with the AMR trend. |
| In the text | |
Current usage metrics show cumulative count of Article Views (full-text article views including HTML views, PDF and ePub downloads, according to the available data) and Abstracts Views on Vision4Press platform.
Data correspond to usage on the plateform after 2015. The current usage metrics is available 48-96 hours after online publication and is updated daily on week days.
Initial download of the metrics may take a while.