Fig. 3.
Download original image
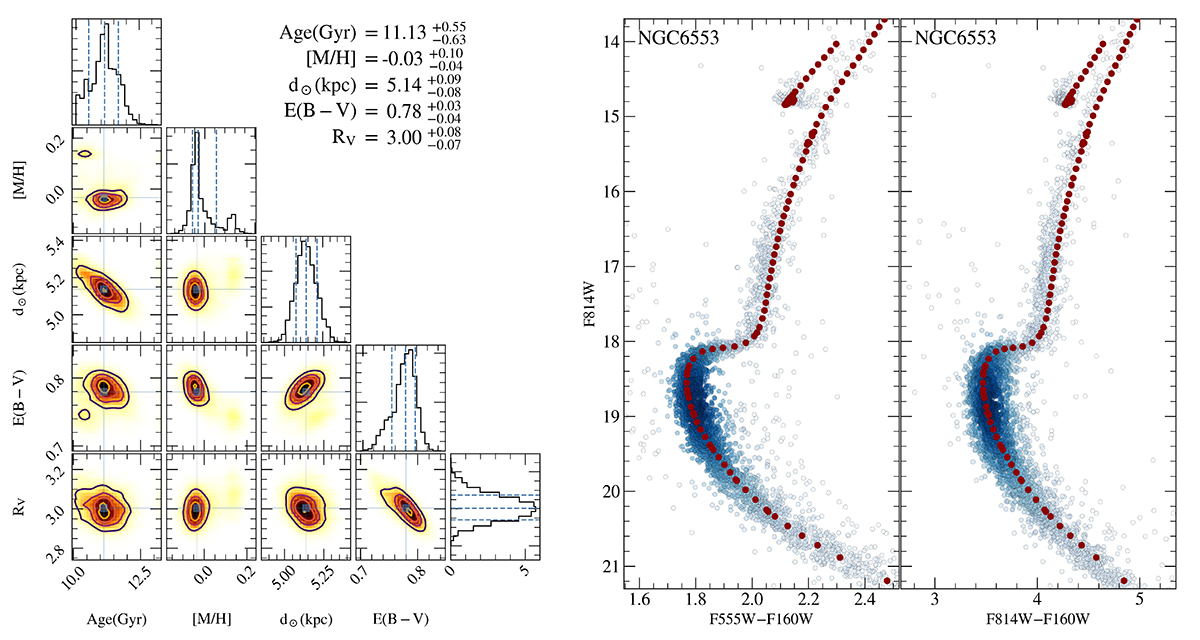
Isochrone fitting result for NGC 6553. Left: Corner plot displaying the posterior probability distributions of the fundamental parameters obtained from isochrone fitting. The 1D marginalised distributions along the diagonal show the median values (solid lines) and the 16th–84th percentile ranges (dashed lines), while the 2D contour plots depict the covariances between parameters. The best-fit values with uncertainties are listed in the upper right corner. Right: Observed CMDs in the HST filters: F814W vs. F390W–F814W (left panel) and F814W vs. F555W–F814W (right panel). The CMDs are coloured by density. The best-fit isochrone, derived from the MCMC analysis, is overlaid in red. The isochrone accurately reproduces the main sequence, subgiant branch, and red giant branch, thus validating the derived cluster parameters.
Current usage metrics show cumulative count of Article Views (full-text article views including HTML views, PDF and ePub downloads, according to the available data) and Abstracts Views on Vision4Press platform.
Data correspond to usage on the plateform after 2015. The current usage metrics is available 48-96 hours after online publication and is updated daily on week days.
Initial download of the metrics may take a while.