| Issue |
A&A
Volume 698, June 2025
|
|
|---|---|---|
| Article Number | A129 | |
| Number of page(s) | 9 | |
| Section | Stellar structure and evolution | |
| DOI | https://doi.org/10.1051/0004-6361/202554388 | |
| Published online | 06 June 2025 | |
SN 2024abfo: A partially stripped type II supernova from a yellow supergiant
1
INAF – Osservatorio Astronomico di Brera, Via E. Bianchi 46, I-23807 Merate, (LC), Italy
2
INAF – Osservatorio Astronomico di Padova, Vicolo dell’Osservatorio 5, I-35122 Padova, Italy
3
Department of Physics, University of Oxford, Keble Road, Oxford OX1 3RH, UK
4
Astrophysics Research Centre, School of Mathematics and Physics, Queen’s University Belfast, Belfast BT7 1NN, UK
5
Instituto de Alta Investigación, Universidad de Tarapacá, Casilla 7D, Arica, Chile
6
Graduate Institute of Astronomy, National Central University, 300 Jhongda Road, 32001 Jhongli, Taiwan
7
School of Physics and Astronomy, University of Leicester, University Road, Leicester LE1 7RH, UK
8
Astrophysics Research Institute, Liverpool John Moores University, ic2, 146 Brownlow Hill, Liverpool L3 5RF, UK
9
CENTRA, Instituto Superior Técnico, Universidade de Lisboa, Av. Rovisco Pais 1, 1049-001 Lisboa, Portugal
10
INAF-Osservatorio Astronomico di Capodimonte, Salita Moiariello 16, I-80121 Naples, Italy
11
European Southern Observatory, Alonso de Córdova 3107, Casilla 19, Santiago, Chile
12
Millennium Institute of Astrophysics MAS, Nuncio Monseñor Sótero Sanz 100, Off. 104, Providencia, Santiago, Chile
13
Institute for Astronomy, University of Hawai’i, 2680 Woodlawn Drive, Honolulu, HI 96822, USA
14
Astronomical Observatory, University of Warsaw, Al. Ujazdowskie 4, 00-478 Warszawa, Poland
15
Institut d’Estudis Espacials de Catalunya (IEEC), Edifici RDIT, Campus UPC, 08860 Castelldefels, (Barcelona), Spain
16
Institute of Space Sciences (ICE, CSIC), Campus UAB, Carrer de Can Magrans, s/n, E-08193 Barcelona, Spain
17
Department of Physics and Astronomy, University of Turku, Vesilinnantie 5 FI-20500, Finland
18
Cardiff Hub for Astrophysics Research and Technology, School of Physics & Astronomy, Cardiff University, Queens Buildings, The Parade, Cardiff CF24 3AA, UK
19
Finnish Centre for Astronomy with ESO, (FINCA), University of Turku, 20014 Turku, Finland
20
School of Physics, Trinity College Dublin, The University of Dublin, Dublin 2, Ireland
21
Instituto de Ciencias Exactas y Naturales (ICEN), Universidad Arturo Prat, Iquique, Tarapacá, Chile
22
The Oskar Klein Centre, Department of Astronomy, Stockholm University, Albanova University Center, SE 106 91 Stockholm, Sweden
23
Dipartimento di Fisica e Astronomia “G. Galilei”, Università di Padova, Vicolo dell’Osservatorio 3, I-35122 Padova, Italy
⋆ Corresponding author: This email address is being protected from spambots. You need JavaScript enabled to view it.
Received:
5
March
2025
Accepted:
24
April
2025
Abstract
We present photometric and spectroscopic data of the type IIb supernova (SN) 2024abfo in NGC 1493 (at 11 Mpc). The steroid Terrestrial-impact Last Alert System (ATLAS) survey discovered the object just a few hours after the explosion and observed a fast rise on the first day. Signs of the sharp shock breakout peak and the subsequent cooling phase are observed in the ultraviolet and the bluest optical bands in the first couple of days, while no peak is visible in the reddest filters. Subsequently, in analogy with normal SNe IIb, the light curve of SN 2024abfo rises again in all bands to the broad peak, with the maximum light reached around 1 month after the explosion. Its absolute magnitude at peak is Mr = −16.5 ± 0.1 mag, making it a faint SN IIb. The early spectra are dominated by Balmer lines with broad P Cygni profiles, indicating ejecta velocity of 22 500 km s−1. One month after the explosion, the spectra display a transition towards being He-dominated, though the H lines do not completely disappear, supporting the classification of SN 2024abfo as a relatively H-rich SN IIb. We identify the progenitor of SN 2024abfo in archival images of the Hubble Space Telescope, the Dark Energy Survey, and the XMM-Newton space telescope, in multiple optical filters. From its spectral energy distribution, the progenitor is consistent with being a yellow supergiant, having an initial mass of 15 M⊙. This detection supports an emerging trend of SN IIb progenitors being more luminous and hotter than SN II ones, and being primaries of massive binaries. Within the SN IIb class, fainter events such as SN 2024abfo tend to have cooler and more expanded progenitors than luminous SNe IIb.
Key words: supernovae: general / supernovae: individual: SN2024abfo / galaxies: individual: NGC 1493
© The Authors 2025
 Open Access article, published by EDP Sciences, under the terms of the Creative Commons Attribution License (https://creativecommons.org/licenses/by/4.0), which permits unrestricted use, distribution, and reproduction in any medium, provided the original work is properly cited.
This article is published in open access under the Subscribe to Open model. This email address is being protected from spambots. You need JavaScript enabled to view it. to support open access publication.
1. Introduction
Type IIb supernovae (SNe) are a type of core-collapse event from relatively massive and partially envelope-stripped stars (Woosley et al. 1987; Filippenko et al. 1993). During the first ∼30 days after the explosion, their spectra show strong and broad Balmer lines with P Cygni profiles. Later, the H lines become weaker, while the He I lines increase in intensity, becoming the dominant spectral features. Hence, in a timescale of 1 month, SNe IIb evolve from H-dominated to He-dominated spectra (see Filippenko 1997, for a review). The best-known SN IIb is SN 1993J (Wheeler et al. 1993; Richmond et al. 1994; Woosley et al. 1994; Barbon et al. 1995), although large samples of SNe IIb have also been studied (Modjaz et al. 2014; Bianco et al. 2014; Shivvers et al. 2019; Pessi et al. 2019; Rodríguez et al. 2023).
In a few notable cases, the progenitors of SNe IIb have been detected in archival images from the Hubble Space Telescope (HST), allowing the determination of their luminosities and colours, and therefore their masses and spectral types. Their typical progenitors have been found to be relatively massive (10–18 M⊙) and extended (R ≃ 200–600 R⊙, see e.g. Ouchi & Maeda 2017; Yoon et al. 2017; Sravan et al. 2019) supergiant stars, with photospheric temperatures spanning a wide range of values (4200–11 000) K and luminosities in the range log L/L⊙ ≃ 4.7 − 5.1 (Crockett et al. 2008; Van Dyk et al. 2011, 2014; Kilpatrick et al. 2017; Tartaglia et al. 2017; Niu et al. 2024).
We present the study of the recently discovered SN 2024abfo, a type IIb SN in the nearby galaxy NGC 1493. We show that the progenitor is detected in archival images, including from HST, and that it is compatible with the explosion of a yellow supergiant (YSG) star.
2. Discovery and host galaxy
SN 2024abfo1 was discovered on 2024 November 15.99742 (Modified Julian Date, or MJD = 60629.9974) by the Asteroid Terrestrial-impact Last Alert System (ATLAS, Tonry et al. 2018), through the Transient Science Server (Smith et al. 2020) at an ATLAS orange (o) AB magnitude of o = 18.55 ± 0.18. The SN exploded in the outskirts of the nearby galaxy NGC 1493 (∼11 Mpc, Smith et al. 2024), at celestial coordinates α = 03:57:25.61, δ = −46:11:07.6. SN 2024abfo was classified on 2024 December 11 as a young type II SN by Wet et al. (2024a).
We define as discovery epoch the MJD of the third image in a sequence of 30-second ATLAS exposures resulting in a 5σ detection (see Smith et al. 2020, for a discussion on flagging discoveries in the ATLAS difference images, and the requirement for three 5σ detections). The source, detected with the ATLAS South African unit, was vetted by humans and registered on the Transient Name Server 12.7 hours later at MJD = 60630.5264 (Tonry et al. 2024; Smith et al. 2024).
The ATLAS Transient Server automatically runs forced photometry at the positions of candidate extragalactic transients, and this service is also publicly available (Shingles et al. 2021). The forced photometry for SN 2024abfo indicates further detections on the night before the formal discovery. Four exposures were obtained on 2024 November 14, taken with the ATLAS Chile unit. The first two images show no flux from the transient, neither through forced point spread function measurements nor in a visual inspection. The second two exposures indicate a rapidly rising supernova, suggesting we have caught the shock breakout (SBO) within the hour spanning the four ATLAS exposures. The forced flux measurements show that some supernova signal is detected between the two exposures taken on MJD 60628.28227 and 60628.29940 (hence, separated by 24.7 minutes). As observed in the early light curve of SN 2023ixf (Li et al. 2024), the flux during this very early phase rises faster than a simple fireball model (f ∝ (t − t0)2). To estimate the time of first light, we adopted a broken power law fit (Eq. (1) of Li et al. 2024) applied to the forced photometry on the eight individual 30-second exposure points on the nights of MJD 60628 and 60629, and find t0 = 60628.28 ± 0.02. We caution that between the two detections on MJD 60628 and the next set of images 1.7 days later, there may well have been a strong SBO signature that we have not observed.
The host galaxy NGC 1493 is a barred spiral with morphological classification as SB(r)cd (according to de Vaucouleurs et al. 1991). Its redshift is z = 0.003512. According to the NASA/IPAC Extragalactic Database (NED), the mean of the redshift-independent distance is 10.85 ± 0.53 Mpc (μ = 30.18 ± 0.11 mag), which we adopted in this work. These estimates come from the Tully-Fisher method, such as from Bottinelli et al. (1984, 1985, 1986), and Tully & Fisher (1988). The kinematic distances on NED are compatible, with values in the range 12 ± 1 Mpc for H0 = 73 km s−1. The galactic reddening towards SN 2024abfo is modest, at AV = 0.03 mag (Schlafly & Finkbeiner 2011), and the internal reddening is negligible (see Sect. 4) as we do not detect Na I D absorption lines in the SN spectra at the host galaxy redshift.
We estimated the metallicity at the location of SN 2024abfo by exploiting the statistical approach of Pilyugin et al. (2004) (their Equation 12). That relation between the Oxygen abundance and MB is valid at 0.4 × R25 (83″ for NGC 1493). SN 2024abfo is located 93″3 from the centre of the host galaxy, hence the approximation is fair. Using B = 11.88 mag (Lauberts & Valentijn 1989), we obtain 12+log(O/H) = 8.38 ± 0.70, hence possibly a sub-solar environment. Assuming 12+log(O/H) = 8.69 dex for the Sun (Asplund et al. 2021), we get 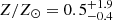 .
.
3. Photometric evolution
3.1. Ultraviolet and optical observations
SN 2024abfo was discovered very early, when it was still at an absolute magnitude of Mo = −11.7 ± 0.2 mag, and was observed to rise rapidly soon after the discovery. We started our multi-band follow-up a few days later, and the campaign lasted 3 months. We collected Swift ultraviolet (UV) and optical photometric data with the facilities listed in Table A.1. The photometric data were reduced using standard procedures with the dedicated SNOoPY pipeline4. The Swift UV data were reduced with the HEASOFT pipeline v. 6.325. We also retrieved already calibrated measurements from the public surveys ATLAS and Panoramic Survey Telescope & Rapid Response System (Pan-STARRS DR1, or PS1; Chambers et al. 2016). The final UV and optical (Sloan, Johnson, and ATLAS) magnitudes are listed in the online supplementary materials, while the light curves are plotted in Figure 1, left panel.
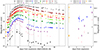 |
Fig. 1. Left: UV and optical light curves of SN 2024abfo in the first 3 months. Dashed grey vertical lines mark the epochs of the spectra. Right: Zoom-in on the early evolution in the ATLAS, UV, and blue filters, highlighting the possible SBO and shock cooling. |
After the fast rise observed by ATLAS, possibly linked to an SBO event (Falk & Arnett 1977; Nakar & Sari 2010; Waxman et al. 2017), as described in Sect. 2, the bluer light curves decline slightly, while the redder bands’ magnitudes remain fairly constant (at V ∼ 16.8 mag). Instead, the UV data taken by Swift with the Ultraviolet/Optical Telescope (UVOT) instrument show a fast flux decline in the first two observations, which is clear evidence of SBO cooling (Fig. 1, right panel). From +4 days, the light curves rise again in all filters (including those in the UV) towards the second, broader and brighter maximum, which is reached in the r-band +24.1 ± 0.1 days from the explosion (obtained by fitting a third-order polynomial on the data between +10 and +30 days). In the UV filters, the maximum is reached between +16 (UWM2) and +19 days (u), while in the i and z bands it is reached 2 days after the r-band.
After maximum, the optical light curves decline linearly and slowly, while the UV light curves decline much faster. In the first 2 months after the maximum, the r-band light curve declines by only ∼2 magnitudes, following a linear slope of 2.1 ± 0.1 mag (100 d)−1.
3.2. Bolometric light curve
We constructed the pseudo-bolometric light curve of SN 2024abfo from the contribution from UVW2 to z bands. For epochs without observations in some bands, we interpolated the available data using the r-band light curve as a reference and assuming a constant colour index. The pseudo-bolometric light curve is shown in Fig. 2.
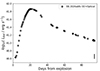 |
Fig. 2. Pseudo-bolometric UV+optical light curve of SN 2024abfo. The systematic error bar due to the uncertainty on the distance is reported in the bottom right corner. |
We applied the simple “Arnett rule” (Arnett 1982) to estimate key parameters of the SN explosion. For the ejecta mass, Mej, we used Equation (1) of Prentice et al. (2019), adopting κ = 0.07 cm2 g−1, tp = 21.6 ± 0.4 days (time between the explosion and the peak of the bolometric light curve), and vej = 8000 ± 500 km s−1 as measured from the position of the minimum of the P Cygni profile of the He I 5876 line in the +23 days spectrum (the closest to the peak) as a probe of the photospheric expansion velocity. With these numbers, we estimate Mej = 4.1 ± 0.7 M⊙. The velocity of the He I line is similar to that of the Fe lines, indicating that the line forms at the base of the He shell as a result of non-thermal excitation (Lucy 1991; Hachinger et al. 2012). Therefore, the mass that is estimated with this method does not include the He shell and the H shell above it, both of which have low opacity, and should thus be increased by 1–2 M⊙. Finally, the estimation of the kinetic energy using Equation (5) of Prentice et al. (2016) is Ek = (1.57 ± 0.45)×1051 erg. The uncertainty inherent with the approach above is emphasised if the velocity of an H line is used. This probes the outermost regions of the ejecta, which carry most of the Ek: if we use the velocity measured from the Hα P Cygni profile at +23 d as the proxy of the photospheric expansion velocity (13 100 ± 400 km s−1), we obtain Mej = 6.7 ± 0.7 M⊙, Ek = (6.7 ± 1.1)×1051 erg. This is also not a credible result, because the He and H shells have lower opacity than the metal-rich inner layers. The actual Ek probably lies somewhere in between. From the peak bolometric luminosity of 1041.87 ± 0.12 erg s−1, and tp, we can also provide an estimate of M56Ni using the same Arnett model and Equation (3) of Prentice et al. (2016). We obtain M56Ni = 0.042 ± 0.014 M⊙, which is close to the value calculated for other SNe IIb (among those reported by Prentice et al. 2016, only SN 2011hs is significantly lower).
The radioactive-powered part of the light curve starts to rise at +4 days; therefore, according to the Piro et al. (2021) model6, tph ≈ 4 d. Using their same parameters and coefficients (n = 10, δ = 1.1, K = 0.119, and κ = 0.2 cm2 g−1 to account for the presence of He), and adopting vt = 22 500 km s−1, as measured from the H velocity in the first spectrum, we derive a mass of the H-rich external envelope roughly of the order of Me ≈ 0.08 M⊙.
3.3. Comparisons with similar objects
SN 2024abfo reaches an r-band peak absolute magnitude of Mr = −16.5 ± 0.1 mag (Fig. 3), making it a relatively underluminous SN IIb (as most SNe IIb peak in the range −18.5 ≤ MR ≤ −16.0 mag; see Morales-Garoffolo et al. 2014; Rodríguez et al. 2023). Therefore, we select comparison objects among faint SNe IIb events, such as SNe 2011dh (Marion et al. 2014), 2011ei (Milisavljevic et al. 2013), and 2015as (Gangopadhyay et al. 2018), plus SN 1987A – which is a canonical comparison object, though more H-rich.
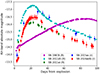 |
Fig. 3. R/r-band absolute light curve of SN 2024abfo compared with those of the faint type IIb SNe 2011dh (Ergon et al. 2014), 2011ei, and 2015as, plus the peculiar type II SN 1987A (Menzies et al. 1987; Catchpole et al. 1987). |
As can be seen in Fig. 3, the peak absolute magnitude of SN 2024abfo in the r-band is ∼0.7 mag fainter than SN 2011dh and ∼0.4 mag dimmer than SN 2015as, but ∼0.3 mag brighter than SN 2011ei. Instead, its peak luminosity matches that of SN 1987A (in the R-band, Hamuy et al. 1988). We note, however, that in SN 1987A the maximum is reached 3 months after the explosion, while in SN 2024abfo the peak is reached after less than 1 month. The rise time of SN 2024abfo from the explosion to the maximum light in the r-band is around 24 days, slightly longer than the average inferred from large samples of SNe IIb (21.3 ± 2.1 days, Pessi et al. 2019). Finally, the post-peak light curve is parallel to that of SN 2011dh, in other words, they have the same linear decline slope.
3.4. X-rays and radio observations
SN 2024abfo was observed by Swift+X-ray Telescope (XRT) on six occasions starting on 2024 November 16 at 20:26:10 UT. A weak source is detected in the first observations of 1.1 ks, with a count rate of (8.0 ± 3.7)×10−3 c s−1 (four photons, signal-to-noise ratio 2.2). The source is then detected with an X-ray light curve tracking the optical one (see Figure 4). It should be noted that in a previous Chandra image no sources appear in the nearby region surrounding SN 2024abfo. The X-ray observations point towards the detection of the SBO and cooling from SN 2024abfo also at high energies.
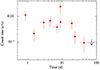 |
Fig. 4. X-ray light curve of SN 2024abfo, collected by Swift/XRT. The curve has been adaptively binned with a constant number of counts. The conversion factor for a power law model to a 0.3–10 keV unabsorbed flux is 6 × 10⁻¹¹ erg cm−2 counts−1. |
A reasonable spectrum can be obtained only for the entire dataset, collecting ∼15 source counts. Fixing the column density to the galactic value of ∼1020 cm−2 (Willingale et al. 2013), one derives a power law photon index of 1.9 ± 0.8 (90% confidence level) and an average 0.3–10 keV unabsorbed flux of 2 × 10⁻¹⁴ erg s−1 cm−2, or a bremsstrahlung temperature  keV and a factor ∼2 lower flux.
We remark that SN 2024abfo has also been detected at radio wavelengths by the Australia Telescope Compact Array at 9.0 GHz on 2024 November 21 (Rose 2024). The flux density at 9.0 GHz is 0.36 ± 0.03 mJy, implying a luminosity of 5.2 × 1025 erg s−1 Hz−1 at phase +7 d, while SN 2024abfo is not detected at 5.5 GHz to a 3σ upper limit of 0.06 mJy (Rose et al. 2024), suggesting that the source was still in the early phase of evolution.
4. Spectral evolution
SN 2024abfo was classified on 2024 November 16, 2.5 days after discovery, as a young type II SN (Wet et al. 2024b). In this first spectrum, shown in Figure 5, the Hα line has a broad P Cygni profile. The expansion velocity measured from the position of the blueshifted minimum of the broad Hα P Cygni is vHα = −22 500 ± 1000 km s−1, which is extremely fast, even accounting for the very early phase at which the spectrum was taken.
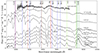 |
Fig. 5. Spectra of SN 2024abfo. The positions of the main lines are marked. The spectra are shifted by a constant for clarity. |
We conducted a spectroscopic follow-up of SN 2024abfo, during which we collected nine optical spectra spanning the first 3 months of evolution. The log of spectroscopic observations is provided in Table A.2, and the spectral time series is presented in Figure 5. The spectra from the 3.58 m New Technology Telescope (NTT), equipped with the ESO Faint Object Spectrograph and Camera version 2 (EFOSC2) instrument, were collected in the framework of the extended European Southern Observatory Spectroscopic Survey of Transient Objects (ePESSTO+) collaboration, and reduced with a pyraf-based pipeline (PESSTO) optimised for the EFOSC2 instrument (Smartt et al. 2015).
The spectrum at +7 days, shown in Figure 5, still presents Hα with a broad P Cygni profile, from which we infer an ejecta velocity of vHα = −17 500 ± 500 km s−1. The P Cygni profile is now also visible in the Hβ and Ca II near-infrared (NIR) lines, while a trapezoidal emission from He I 5876 or Na I D also appears. In the +23 d spectrum, the main He I emission lines start to appear. In particular, the blend of He Iλ6678 with the Hα line produces a broad flat-topped feature. In the +37 d spectrum, the continuum is redder due to the blanketing from metal lines, while a very broad P Cygni profile due to the Ca II NIR triplet also emerges in the reddest region of the spectrum. While He Iλ7065 is now clearly detected, both He Iλ5876 and λ6678 become stronger than Hα, and He Iλ5015 is more prominent than Hβ, though the H lines still remain visible. Through the measure of the minimum of the P Cygni profile of Hα, we note a clear declining trend of the ejecta velocity as time progresses, with vHα decreased to 10 000 km s−1 in the +37 d spectrum. Although the +38 d spectrum has a higher resolution, the narrow Na I D absorption lines at the rest wavelength and at the redshift of NGC 1493 are not detected; hence, according to the Poznanski et al. (2012) relation, confirming the minimal galactic and host galaxy extinction contributions. We measured the evolution of the velocities of the Hα, He Iλ5876, and Fe IIλ5169 lines in all the spectra, from the position of the minimum of the respective P Cygni profiles. The values are reported in Table A.3.
In the +88 d spectrum, some nebular transitions also start to appear, like the O I λ7774 and λ8446. The [O I] λ6300 is also present in emission. The He Iλ7281 line is now stronger than the λ7065 one, which suggests a contamination from the [Ca II] λλ 7291,7324 doublet. The Hα P Cygni is narrower than in the +58 d spectrum. From its minimum, we derive a velocity of vHα = −10 500 ± 500 km s−1.
5. Progenitor detection
We analysed an HST/WFPC2 image taken on 2001 May 02 with the F814W filter (Proposal ID 8599, PI Boeker). To identify the SN position in the HST image, we used a z-band image (0.4″ pix−1; 26′×26′ field of view; exposure 200 s) obtained on 2024 November 22.55 UT at Las Cumbres Observatory (LCO), under seeing 1.7″. We achieve good-precision relative astrometry between the HST pre-explosion images and the LCO post-explosion image by geometrically transforming the former to the latter. We register five point-like sources in common between the two datasets. Then, using geomap and geoxytran (two IRAF tasks), we carried out a geometrical transformation between the sets of coordinates. The uncertainty in the SN position was calculated as a quadrature sum of the rms of the geometric transformation (0.16″) and the error on the SN centroid position in the LCO image (0.12″). The progenitor star is clearly visible at the same position as SN 2024abfo, at pixel coordinates [2489.2, 3643.3], with F814W = 22.32 ± 0.05 AB mag (Fig. 6, left). Using the adopted distance to NGC 1493, this corresponds to an absolute MF814W = −7.9 ± 0.1 mag. The same source is also detected in the stacked frames between 2013 and 2017 from the Dark Energy Spectroscopic Instrument (DESI) Legacy Imaging Surveys (DESI Collaboration 2016; Dey et al. 2019) DR10, with catalogue7 Sloan filters of magnitudes g = 22.32, r = 22.21, i = 22.12, and z = 22.64 AB mag (Fig. 6, centre). We assumed an error of 0.1 mag on these values. The progenitor is also detected in images taken by XMM-Newton/OM on 2010 July 15 (PI Mathur), at B = 22.66 ± 0.23 and V = 22.44 ± 0.06 Vega mag (Fig. 6, right).
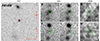 |
Fig. 6. Left: Progenitor of SN 2024abfo detected in an HST/WFPC2 F814W image obtained in 2001. The circle is centred at the transformed position of SN 2024abfo and has a radius equal to the uncertainty in the SN position of 0.2″. Centre: Progenitor of SN 2024abfo visible in the stacked images from DESI Legacy Surveys DR10, taken between 2013 and 2017. In a clockwise sense from the upper left corner: Sloan g, r, i, and z images. Right: Progenitor also detected by XMM-Newton/OM in 2010 in B (top) and V (bottom) filters. The circles are centred at the position of SN 2024abfo; they have a radius of 1″ in the DESI frames and 2″ in the XMM frames. In all images, north is up and east to the left. |
These colours and the inferred absolute magnitudes suggest a relatively blue and luminous progenitor. We constructed the spectral energy distribution (SED) by converting the observed magnitudes into flux densities at the effective wavelengths of each filter, after correcting for the small interstellar extinction. We compared the SED of the progenitor of SN 2024abfo with the ATLAS9 stellar atmospheric models by Kurucz (1979, 1993)8. We adopted the models with Z/Z⊙ = 0.5 (hence log(Z) = − 0.3) and log(g) = 1.0. We found good matches for models with photospheric temperatures between 6250 and 7000 K, and stellar radii between 215 and 270 R⊙ (for the hottest and coldest models, respectively). Their corresponding bolometric luminosities are (3.83 ± 0.04)×1038 erg s−1 (hence, log(L/L⊙) = 5.00 ± 0.05 (accounting for the error on the distance modulus). These parameters correspond to a YSG of late F spectral type. The matches of the ATLAS9 models to the progenitor’s SED are shown in Fig. 7. The mean progenitor location in the Hertzsprung-Russell diagram (HRD) is shown in Fig. 8. We also over-plotted Binary Population and Spectral Synthesis (BPASS, v. 2.3) evolutionary tracks (Byrne et al. 2022; Stanway & Eldridge 2018; Eldridge et al. 2017) for binary systems with a metallicity of Z = 0.01, a secondary vs. primary mass ratio q = 0.1, and a binary orbital period of P = 1000 days. We chose these parameters as being illustrative of a detached system. We favoured a binary progenitor based on the observed SED (rather blue, indicative of envelope stripping), the fact that a majority of massive stars are found in binary systems (Sana et al. 2012), and the detection of the surviving companion in stripped-envelope SNe (for instance, Maund et al. 2004; Fox et al. 2022). The tracks shown in the figure are for primaries with initial masses between 13 and 25 M⊙. The comparison allows us to estimate for the progenitor of SN 2024abfo an initial mass of 15 M⊙. The progenitor of SN 2024abfo is among the hottest progenitors identified or derived for SNe IIb, with a photospheric temperature of 6250–7000 K (or log(Teff) = 3.80 − 3.85), close to that found for the progenitors of SN 2016gkg (9550 K; Kilpatrick et al. 2017) and SN 2008ax (7900–20 000 K; Folatelli et al. 2015).
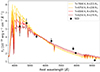 |
Fig. 7. SED of the progenitor of SN 2024abfo compared to ATLAS9 stellar atmospheric models from Kurucz (1993). Good matches are found with models with temperatures between 6250 and 7000 K, and radii between 215 and 270 R⊙. |
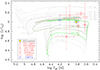 |
Fig. 8. Location of the progenitor of SN 2024abfo within the HRD from the match of ATLAS9 models to its SED. BPASS evolutionary tracks for binaries between 13 and 25 M⊙ are also plotted for comparison. The progenitor is consistent with a star with an initial mass of 15 M⊙. The location of the other identified progenitors of SNe IIb and of SN 1987A are also shown. |
The source at the position of SN 2024abfo in the HST/WFPC2 images appears to be very isolated. Although the DESI images have low spatial resolution (0.26″), the HST/WFPC2 images indicate no strong contamination of the single PSF fit that describes the source. This is only true for the F814W and DESI i-band images. The bluer filters of DESI show nearby extended flux to the south-east. While the evidence of a point-like source suggests we are measuring the progenitor system rather than a cluster or stellar blends, we caution that higher resolution imaging of SN IIb progenitors in the years after explosion shows that the luminosity can be overestimated (e.g. Folatelli et al. 2015; Kilpatrick et al. 2022), although in some cases it is unaffected, as in the case of SN 2011dh (Maund et al. 2015).
Furthermore, the progenitor is likely a binary system that could be composed of a slightly cooler supergiant and a fainter, but hotter and more compact companion (like the system of SN 1993J, Maund et al. 2004), and we were measuring only the integrated flux. If the mass ratio, q, is indeed 0.1, it means that the secondary star would have a mass of only ∼1.5 M⊙, which does not contribute significantly to the luminosity of the system.
6. Discussion and conclusion
In the spectra of normal SNe IIb, the He I lines become the most prominent features about 1 month past explosion, while the H lines almost disappear. In contrast, while in the +29 d spectrum of SN 2024abfo the He lines are dominant, Hα and Hβ are still present, suggesting more H-rich ejecta. Therefore, while the progenitor star had likely lost a large fraction of its outer envelope before the core collapse, a significant amount of H was still present. SN 2024abfo is a rare case in which the SBO may have been caught during the discovery, although it is very faint, only noticeable in the early ATLAS data.
According to Chevalier & Soderberg (2010), those SNe IIb showing an early, sharp light-curve peak due to SBO cooling before rising to the main 56Ni-decay-powered maximum (e.g. SN 1993J; Wheeler et al. 1993) arise from the explosion of extended stars, whereas those lacking such a feature originate from more compact objects. Compact SNe IIb progenitors could have been evolved stars, after the Wolf-Rayet phase (Soderberg et al. 2006, and references therein); after the detection of the progenitor of SN 2008ax, they were suggested to be quite massive (≈10–28 M⊙; Crockett et al. 2008). Folatelli et al. (2015) show that the SN 2008ax pre-explosion progenitor source is not single and that a massive interacting binary system is more consistent with the data (an 18 M⊙+12 M⊙ on a  days orbit). Radially extended progenitor configurations may suggest lower-mass single stars or binary progenitor systems, with their outer H envelopes being partially stripped by strong stellar winds or through interaction with the companion, respectively (Podsiadlowski et al. 1992; Folatelli et al. 2014; Fox et al. 2014; Ryder et al. 2018).
We now consider the small sample of SNe IIb with detected progenitors (SNe 1993J, 2008ax, 2011dh, 2013df, 2016gkg, 2017gkk, and 2024abfo; Aldering et al. 1994; Crockett et al. 2008; Maund et al. 2011; Van Dyk et al. 2014; Folatelli et al. 2015; Tartaglia et al. 2017; Niu et al. 2024; this work) or whose properties have been determined via hydrodynamical modelling of the bolometric light curve (for instance, SNe 2011fu and 2011hs; Morales-Garoffolo et al. 2015; Bufano et al. 2014). We note a general trend (Fig. 9): SNe IIb that are fainter at peak (such as SNe 2011dh9, 2011ei, and 2015as) usually do not show (or it is faint, like in SN 2024abfo) an early, short shock-cooling peak in their light curves. Instead, this feature is clearly present in the most luminous events, like in SNe 2011fu and 2013df; Morales-Garoffolo et al. 2014, 2015). At the same time, as highlighted in Table A.4, more luminous SNe IIb (often showing the first peak) have cooler and more extended progenitors, while lower-luminosity objects (often without the first peak) have hotter and more compact progenitors. If we extend the sample to other faint SNe IIb, such as SN 2011ei and 2015as (already shown in Fig. 3), this trend becomes even more pronounced. SN 2016gkg is somewhat of an exception, given that it has a hot (9550 K) and less extended (250 R⊙; Kilpatrick et al. 2017) progenitor, while presenting a first early light-curve peak (Bersten et al. 2018).
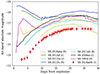 |
Fig. 9. R/r-band early absolute light curves of a small SNe IIb sample with well-constrained progenitor parameters (see the text). |
Interestingly, most SN IIb progenitors have a luminosity in the log(L/L⊙) = 4.9 − 5.1 range, higher than normal SNe II (4.2–4.7; Smartt 2009). SN 2024abfo is another object that supports this emerging trend. This is unlikely to be an observational bias, as the smaller bolometric correction associated with white and/or yellow supergiant stars should allow us to detect them even at lower bolometric luminosities compared to the red supergiant progenitors of typical SNe IIP. In addition, there is growing evidence that the progenitors of SNe IIb are preferentially found in high-mass binaries, while normal SNe II are the outcome of single-star evolution. A continuum in the progenitor properties seems to exist, from the most H-rich red supergiant stars (producing normal type II and/or IIP SNe, e.g. Smartt et al. 2009), through the moderately H-rich yellow hypergiant precursors of SNe IIL (Elias-Rosa et al. 2010, 2011; Fraser et al. 2010), SN 2024abfo, and the He-rich progenitors of SNe IIb, and finally to the H-free stars generating SNe Ib.
In conclusion, SN 2024abfo is a peculiar SN IIb, with a faint, just noticeable first peak, but with evidence of shock cooling and H-rich spectra. It reached a faint peak luminosity of Mr = −16.5 mag 24 days after the explosion, then faded slowly and linearly for at least 2 months. Its progenitor was consistent with a hot YSG, with a more massive H envelope than the typical progenitors of SNe IIb, which explains the persistence of H lines even at late phases.
Data availability
The observed optical Sloan, Johnson, ATLAS, and Swift magnitudes are tabulated in the photometry tables, which are available at the CDS via anonymous ftp to cdsarc.cds.unistra.fr (130.79.128.5) or via https://cdsarc.cds.unistra.fr/viz-bin/cat/J/A+A/698/A129. All the spectra are released on the WISEREP interface (https://www.wiserep.org/object/26537).
Also known as ATLAS24qew, PS24lge.
Universal Time (UT) is used throughout the paper.
NED reports an axis ratio of 0.93, equivalent to an inclination of 21.5°. If SN 2024abfo sits on the polar axis, the de-projected distance from the host centre turns to 100″.
ecsnoopy is a package for SN photometry using PSF fitting and/or template subtraction developed by E. Cappellaro. A package description can be found at http://sngroup.oapd.inaf.it/snoopy.html.
NASA High Energy Astrophysics Science Archive Research Center – Heasarc 2014.
Given the small SBO, this model is not accurate at obtaining the progenitor radius (see Sect. 5).
Retrieved here: https://archive.stsci.edu/hlsps/reference-atlases/cdbs/grid/k93models/
But see the g-band light curve from Arcavi et al. (2011).
Acknowledgments
We thank the anonymous referee for the useful comments and suggested corrections to the manuscript. We thank N. Elias-Rosa for her comments. AR acknowledges financial support from the GRAWITA Large Program Grant (PI P. D’Avanzo). AR, AP, GV, IS, SB acknowledge financial support from the PRIN-INAF 2022 “Shedding light on the nature of gap transients: from the observations to the models”. SJS acknowledges funding from STFC Grants ST/Y001605/1, ST/X006506/1, ST/T000198/1, a Royal Society Research Professorship and the Hintze Charitable Foundation. T.-W.C. acknowledges the Yushan Fellow Program by the Ministry of Education, Taiwan for the financial support (MOE-111-YSFMS-0008-001-P1). JD acknowledge support by FCT for CENTRA through Project No. UIDB/00099/2020 and under the PhD grant 2023.01333.BD. T.E.M.B. is funded by Horizon Europe ERC grant no. 101125877. NSF’s NOIRLab (National Optical-Infrared Astronomy Research Laboratory), the US center for ground-based optical-infrared astronomy, operates the Cerro Tololo Inter-American Observatory (CTIO). It is managed by the Association of Universities for Research in Astronomy (AURA) under a cooperative agreement with NSF. Based on observations collected at the European Organisation for Astronomical Research in the Southern Hemisphere, Chile, as part of ePESSTO+ (the advanced Public ESO Spectroscopic Survey for Transient Objects Survey – PI: Inserra), under ESO program ID 112.25JQ. Support to ATLAS was provided by NASA grant NN12AR55G. The Pan-STARRS1 Surveys (PS1) and the PS1 public science archive have been made possible through contributions by the Institute for Astronomy, the University of Hawaii, the Pan-STARRS Project Office, the Max-Planck Society and its participating institutes, the Max Planck Institute for Astronomy, Heidelberg and the Max Planck Institute for Extraterrestrial Physics, Garching, The Johns Hopkins University, Durham University, the University of Edinburgh, the Queen’s University Belfast, the Harvard-Smithsonian Center for Astrophysics, the Las Cumbres Observatory Global Telescope Network Incorporated, the National Central University of Taiwan, the Space Telescope Science Institute, the National Aeronautics and Space Administration under Grant No. NNX08AR22G issued through the Planetary Science Division of the NASA Science Mission Directorate, the National Science Foundation Grant No. AST-1238877, the University of Maryland, Eotvos Lorand University (ELTE), the Los Alamos National Laboratory, and the Gordon and Betty Moore Foundation. We acknowledge the use of data from the Swift data archive.
References
- Aldering, G., Humphreys, R. M., & Richmond, M. 1994, AJ, 107, 662 [Google Scholar]
- Arcavi, I., Gal-Yam, A., Yaron, O., et al. 2011, ApJ, 742, L18 [Google Scholar]
- Arnett, W. D. 1982, ApJ, 253, 785 [Google Scholar]
- Asplund, M., Amarsi, A. M., & Grevesse, N. 2021, A&A, 653, A141 [NASA ADS] [CrossRef] [EDP Sciences] [Google Scholar]
- Barbon, R., Benetti, S., Cappellaro, E., et al. 1995, A&AS, 110, 513 [NASA ADS] [Google Scholar]
- Bersten, M. C., Folatelli, G., García, F., et al. 2018, Nature, 554, 497 [Google Scholar]
- Bianco, F. B., Modjaz, M., Hicken, M., et al. 2014, ApJS, 213, 19 [Google Scholar]
- Bottinelli, L., Gouguenheim, L., Paturel, G., & de Vaucouleurs, G. 1984, A&AS, 56, 381 [NASA ADS] [Google Scholar]
- Bottinelli, L., Gouguenheim, L., Paturel, G., & de Vaucouleurs, G. 1985, A&AS, 59, 43 [NASA ADS] [Google Scholar]
- Bottinelli, L., Gouguenheim, L., Paturel, G., & Teerikorpi, P. 1986, A&A, 156, 157 [NASA ADS] [Google Scholar]
- Bufano, F., Pignata, G., Bersten, M., et al. 2014, MNRAS, 439, 1807 [Google Scholar]
- Byrne, C. M., Stanway, E. R., Eldridge, J. J., McSwiney, L., & Townsend, O. T. 2022, MNRAS, 512, 5329 [NASA ADS] [CrossRef] [Google Scholar]
- Catchpole, R. M., Menzies, J. W., Monk, A. S., et al. 1987, MNRAS, 229, 15P [NASA ADS] [CrossRef] [Google Scholar]
- Chambers, K. C., Magnier, E. A., Metcalfe, N., et al. 2016, ArXiv e-prints [arXiv:1612.05560] [Google Scholar]
- Chevalier, R. A., & Soderberg, A. M. 2010, ApJ, 711, L40 [NASA ADS] [CrossRef] [Google Scholar]
- Crockett, R. M., Eldridge, J. J., Smartt, S. J., et al. 2008, MNRAS, 391, L5 [NASA ADS] [Google Scholar]
- de Vaucouleurs, G., de Vaucouleurs, A., Corwin, Jr., H. G., et al. 1991, Third Reference Catalogue of Bright Galaxies (New York, USA: Springer) [Google Scholar]
- DESI Collaboration (Aghamousa, A., et al.) 2016, ArXiv e-prints [arXiv: 1611.00036] [Google Scholar]
- Dey, A., Schlegel, D. J., Lang, D., et al. 2019, AJ, 157, 168 [Google Scholar]
- Eldridge, J. J., Stanway, E. R., Xiao, L., et al. 2017, PASA, 34, e058 [Google Scholar]
- Elias-Rosa, N., Van Dyk, S. D., Li, W., et al. 2010, ApJ, 714, L254 [Google Scholar]
- Elias-Rosa, N., Van Dyk, S. D., Li, W., et al. 2011, ApJ, 742, 6 [NASA ADS] [CrossRef] [Google Scholar]
- Ergon, M., Sollerman, J., Fraser, M., et al. 2014, A&A, 562, A17 [NASA ADS] [CrossRef] [EDP Sciences] [Google Scholar]
- Falk, S. W., & Arnett, W. D. 1977, ApJS, 33, 515 [NASA ADS] [CrossRef] [Google Scholar]
- Filippenko, A. V. 1997, ARA&A, 35, 309 [NASA ADS] [CrossRef] [Google Scholar]
- Filippenko, A. V., Matheson, T., & Ho, L. C. 1993, ApJ, 415, L103 [NASA ADS] [CrossRef] [Google Scholar]
- Folatelli, G., Bersten, M. C., Kuncarayakti, H., et al. 2014, ApJ, 792, 7 [Google Scholar]
- Folatelli, G., Bersten, M. C., Kuncarayakti, H., et al. 2015, ApJ, 811, 147 [Google Scholar]
- Fox, O. D., Azalee Bostroem, K., Van Dyk, S. D., et al. 2014, ApJ, 790, 17 [NASA ADS] [CrossRef] [Google Scholar]
- Fox, O. D., Van Dyk, S. D., Williams, B. F., et al. 2022, ApJ, 929, L15 [NASA ADS] [CrossRef] [Google Scholar]
- Fraser, M., Takáts, K., Pastorello, A., et al. 2010, ApJ, 714, L280 [Google Scholar]
- Gangopadhyay, A., Misra, K., Pastorello, A., et al. 2018, MNRAS, 476, 3611 [NASA ADS] [Google Scholar]
- Hachinger, S., Mazzali, P. A., Taubenberger, S., et al. 2012, MNRAS, 422, 70 [NASA ADS] [CrossRef] [Google Scholar]
- Hamuy, M., Suntzeff, N. B., Gonzalez, R., & Martin, G. 1988, AJ, 95, 63 [NASA ADS] [CrossRef] [Google Scholar]
- Kilpatrick, C. D., Foley, R. J., Abramson, L. E., et al. 2017, MNRAS, 465, 4650 [Google Scholar]
- Kilpatrick, C. D., Coulter, D. A., Foley, R. J., et al. 2022, ApJ, 936, 111 [Google Scholar]
- Kurucz, R. L. 1979, ApJS, 40, 1 [NASA ADS] [CrossRef] [Google Scholar]
- Kurucz, R. L. 1993, SYNTHE spectrum synthesis programs and line data (Cambridge, MA, USA: Smithsonian Astrophysical Observatory) [Google Scholar]
- Lauberts, A., & Valentijn, E. A. 1989, The surface photometry catalogue of the ESO-Uppsala galaxies [Google Scholar]
- Li, G., Hu, M., Li, W., et al. 2024, Nature, 627, 754 [NASA ADS] [CrossRef] [Google Scholar]
- Lucy, L. B. 1991, ApJ, 383, 308 [NASA ADS] [CrossRef] [Google Scholar]
- Marion, G. H., Vinko, J., Kirshner, R. P., et al. 2014, ApJ, 781, 69 [NASA ADS] [CrossRef] [Google Scholar]
- Maund, J. R., Smartt, S. J., Kudritzki, R. P., Podsiadlowski, P., & Gilmore, G. F. 2004, Nature, 427, 129 [NASA ADS] [CrossRef] [Google Scholar]
- Maund, J. R., Fraser, M., Ergon, M., et al. 2011, ApJ, 739, L37 [Google Scholar]
- Maund, J. R., Arcavi, I., Ergon, M., et al. 2015, MNRAS, 454, 2580 [Google Scholar]
- Menzies, J. W., Catchpole, R. M., van Vuuren, G., et al. 1987, MNRAS, 227, 39P [Google Scholar]
- Milisavljevic, D., Margutti, R., Soderberg, A. M., et al. 2013, ApJ, 767, 71 [NASA ADS] [CrossRef] [Google Scholar]
- Modjaz, M., Blondin, S., Kirshner, R. P., et al. 2014, AJ, 147, 99 [Google Scholar]
- Morales-Garoffolo, A., Elias-Rosa, N., Benetti, S., et al. 2014, MNRAS, 445, 1647 [Google Scholar]
- Morales-Garoffolo, A., Elias-Rosa, N., Bersten, M., et al. 2015, MNRAS, 454, 95 [CrossRef] [Google Scholar]
- Nakar, E., & Sari, R. 2010, ApJ, 725, 904 [NASA ADS] [CrossRef] [Google Scholar]
- Niu, Z., Sun, N.-C., & Liu, J. 2024, ApJ, 970, L9 [Google Scholar]
- Ouchi, R., & Maeda, K. 2017, ApJ, 840, 90 [NASA ADS] [CrossRef] [Google Scholar]
- Pessi, P. J., Folatelli, G., Anderson, J. P., et al. 2019, MNRAS, 488, 4239 [NASA ADS] [CrossRef] [Google Scholar]
- Pilyugin, L. S., Vílchez, J. M., & Contini, T. 2004, A&A, 425, 849 [NASA ADS] [CrossRef] [EDP Sciences] [Google Scholar]
- Piro, A. L., Haynie, A., & Yao, Y. 2021, ApJ, 909, 209 [NASA ADS] [CrossRef] [Google Scholar]
- Podsiadlowski, P. 1992, PASP, 104, 717 [CrossRef] [Google Scholar]
- Podsiadlowski, P., Joss, P. C., & Hsu, J. J. L. 1992, ApJ, 391, 246 [Google Scholar]
- Poznanski, D., Prochaska, J. X., & Bloom, J. S. 2012, MNRAS, 426, 1465 [Google Scholar]
- Prentice, S. J., Mazzali, P. A., Pian, E., et al. 2016, MNRAS, 458, 2973 [NASA ADS] [CrossRef] [Google Scholar]
- Prentice, S. J., Ashall, C., James, P. A., et al. 2019, MNRAS, 485, 1559 [NASA ADS] [CrossRef] [Google Scholar]
- Richmond, M. W., Treffers, R. R., Filippenko, A. V., et al. 1994, AJ, 107, 1022 [Google Scholar]
- Rodríguez, Ó., Maoz, D., & Nakar, E. 2023, ApJ, 955, 71 [CrossRef] [Google Scholar]
- Rose, K. 2024, ATel, 16920, 1 [Google Scholar]
- Rose, K., Ryder, S., & Driessen, L. 2024, ATel, 16924, 1 [Google Scholar]
- Ryder, S. D., Van Dyk, S. D., Fox, O. D., et al. 2018, ApJ, 856, 83 [NASA ADS] [CrossRef] [Google Scholar]
- Sana, H., de Mink, S. E., de Koter, A., et al. 2012, Science, 337, 444 [Google Scholar]
- Schlafly, E. F., & Finkbeiner, D. P. 2011, ApJ, 737, 103 [Google Scholar]
- Shingles, L., Smith, K. W., Young, D. R., et al. 2021, Transient Name Server AstroNote, 7, 1 [NASA ADS] [Google Scholar]
- Shivvers, I., Filippenko, A. V., Silverman, J. M., et al. 2019, MNRAS, 482, 1545 [Google Scholar]
- Smartt, S. J. 2009, ARA&A, 47, 63 [NASA ADS] [CrossRef] [Google Scholar]
- Smartt, S. J., Eldridge, J. J., Crockett, R. M., & Maund, J. R. 2009, MNRAS, 395, 1409 [CrossRef] [Google Scholar]
- Smartt, S. J., Valenti, S., Fraser, M., et al. 2015, A&A, 579, A40 [NASA ADS] [CrossRef] [EDP Sciences] [Google Scholar]
- Smith, K. W., Smartt, S. J., Young, D. R., et al. 2020, PASP, 132, 085002 [Google Scholar]
- Smith, K. W., Young, D. R., Nicholl, M., et al. 2024, Transient Name Server AstroNote, 341, 1 [Google Scholar]
- Soderberg, A. M., Chevalier, R. A., Kulkarni, S. R., & Frail, D. A. 2006, ApJ, 651, 1005 [CrossRef] [Google Scholar]
- Sravan, N., Marchant, P., & Kalogera, V. 2019, ApJ, 885, 130 [NASA ADS] [CrossRef] [Google Scholar]
- Stanway, E. R., & Eldridge, J. J. 2018, MNRAS, 479, 75 [NASA ADS] [CrossRef] [Google Scholar]
- Tartaglia, L., Fraser, M., Sand, D. J., et al. 2017, ApJ, 836, L12 [NASA ADS] [CrossRef] [Google Scholar]
- Tonry, J. L., Denneau, L., Heinze, A. N., et al. 2018, PASP, 130, 064505 [Google Scholar]
- Tonry, J., Denneau, L., Weiland, H., et al. 2024, Transient Name Server Discovery Report, 2024–4513, 1 [Google Scholar]
- Tully, R. B., & Fisher, J. R. 1988, Catalog of Nearby Galaxies (Cambridge, UK: Cambridge University Press) [Google Scholar]
- Van Dyk, S. D., Li, W., Cenko, S. B., et al. 2011, ApJ, 741, L28 [Google Scholar]
- Van Dyk, S. D., Zheng, W., Fox, O. D., et al. 2014, AJ, 147, 37 [Google Scholar]
- Waxman, E., & Katz, B. 2017, in Handbook of Supernovae, eds. A. W. Alsabti, & P. Murdin (Springer), 967 [CrossRef] [Google Scholar]
- Wet, S. D., Zimmerman, E., & Erasmus, N. 2024a, Transient Name Server AstroNote, 342, 1 [Google Scholar]
- Wet, S. D., Zimmerman, E., & Erasmus, N. 2024b, Transient Name Server AstroNote, 342, 1 [Google Scholar]
- Wheeler, J. C., Barker, E., Benjamin, R., et al. 1993, ApJ, 417, L71 [NASA ADS] [CrossRef] [Google Scholar]
- Willingale, R., Starling, R. L. C., Beardmore, A. P., Tanvir, N. R., & O’Brien, P. T. 2013, MNRAS, 431, 394 [Google Scholar]
- Woosley, S. E., Pinto, P. A., Martin, P. G., & Weaver, T. A. 1987, ApJ, 318, 664 [NASA ADS] [CrossRef] [Google Scholar]
- Woosley, S. E., Eastman, R. G., Weaver, T. A., & Pinto, P. A. 1994, ApJ, 429, 300 [NASA ADS] [CrossRef] [Google Scholar]
- Yoon, S.-C., Dessart, L., & Clocchiatti, A. 2017, ApJ, 840, 10 [NASA ADS] [CrossRef] [Google Scholar]
Appendix A: Complementary tables
Observational facilities and instrumentation used in the photometric follow-up of SN 2024abfo.
Log of the spectroscopic observations of SN 2024abfo.
Evolution of the velocity of the Hα, He Iλ5876 and Fe IIλ5169 lines. Velocities are expressed in km s−1.
Properties of the identified or modelled progenitors of SNe IIb. SN 1987A is also added for comparison.
All Tables
Observational facilities and instrumentation used in the photometric follow-up of SN 2024abfo.
Evolution of the velocity of the Hα, He Iλ5876 and Fe IIλ5169 lines. Velocities are expressed in km s−1.
Properties of the identified or modelled progenitors of SNe IIb. SN 1987A is also added for comparison.
All Figures
|
Fig. 1. Left: UV and optical light curves of SN 2024abfo in the first 3 months. Dashed grey vertical lines mark the epochs of the spectra. Right: Zoom-in on the early evolution in the ATLAS, UV, and blue filters, highlighting the possible SBO and shock cooling. |
| In the text | |
|
Fig. 2. Pseudo-bolometric UV+optical light curve of SN 2024abfo. The systematic error bar due to the uncertainty on the distance is reported in the bottom right corner. |
| In the text | |
|
Fig. 3. R/r-band absolute light curve of SN 2024abfo compared with those of the faint type IIb SNe 2011dh (Ergon et al. 2014), 2011ei, and 2015as, plus the peculiar type II SN 1987A (Menzies et al. 1987; Catchpole et al. 1987). |
| In the text | |
|
Fig. 4. X-ray light curve of SN 2024abfo, collected by Swift/XRT. The curve has been adaptively binned with a constant number of counts. The conversion factor for a power law model to a 0.3–10 keV unabsorbed flux is 6 × 10⁻¹¹ erg cm−2 counts−1. |
| In the text | |
|
Fig. 5. Spectra of SN 2024abfo. The positions of the main lines are marked. The spectra are shifted by a constant for clarity. |
| In the text | |
|
Fig. 6. Left: Progenitor of SN 2024abfo detected in an HST/WFPC2 F814W image obtained in 2001. The circle is centred at the transformed position of SN 2024abfo and has a radius equal to the uncertainty in the SN position of 0.2″. Centre: Progenitor of SN 2024abfo visible in the stacked images from DESI Legacy Surveys DR10, taken between 2013 and 2017. In a clockwise sense from the upper left corner: Sloan g, r, i, and z images. Right: Progenitor also detected by XMM-Newton/OM in 2010 in B (top) and V (bottom) filters. The circles are centred at the position of SN 2024abfo; they have a radius of 1″ in the DESI frames and 2″ in the XMM frames. In all images, north is up and east to the left. |
| In the text | |
|
Fig. 7. SED of the progenitor of SN 2024abfo compared to ATLAS9 stellar atmospheric models from Kurucz (1993). Good matches are found with models with temperatures between 6250 and 7000 K, and radii between 215 and 270 R⊙. |
| In the text | |
|
Fig. 8. Location of the progenitor of SN 2024abfo within the HRD from the match of ATLAS9 models to its SED. BPASS evolutionary tracks for binaries between 13 and 25 M⊙ are also plotted for comparison. The progenitor is consistent with a star with an initial mass of 15 M⊙. The location of the other identified progenitors of SNe IIb and of SN 1987A are also shown. |
| In the text | |
|
Fig. 9. R/r-band early absolute light curves of a small SNe IIb sample with well-constrained progenitor parameters (see the text). |
| In the text | |
Current usage metrics show cumulative count of Article Views (full-text article views including HTML views, PDF and ePub downloads, according to the available data) and Abstracts Views on Vision4Press platform.
Data correspond to usage on the plateform after 2015. The current usage metrics is available 48-96 hours after online publication and is updated daily on week days.
Initial download of the metrics may take a while.