Open Access
Fig. 1.
Download original image
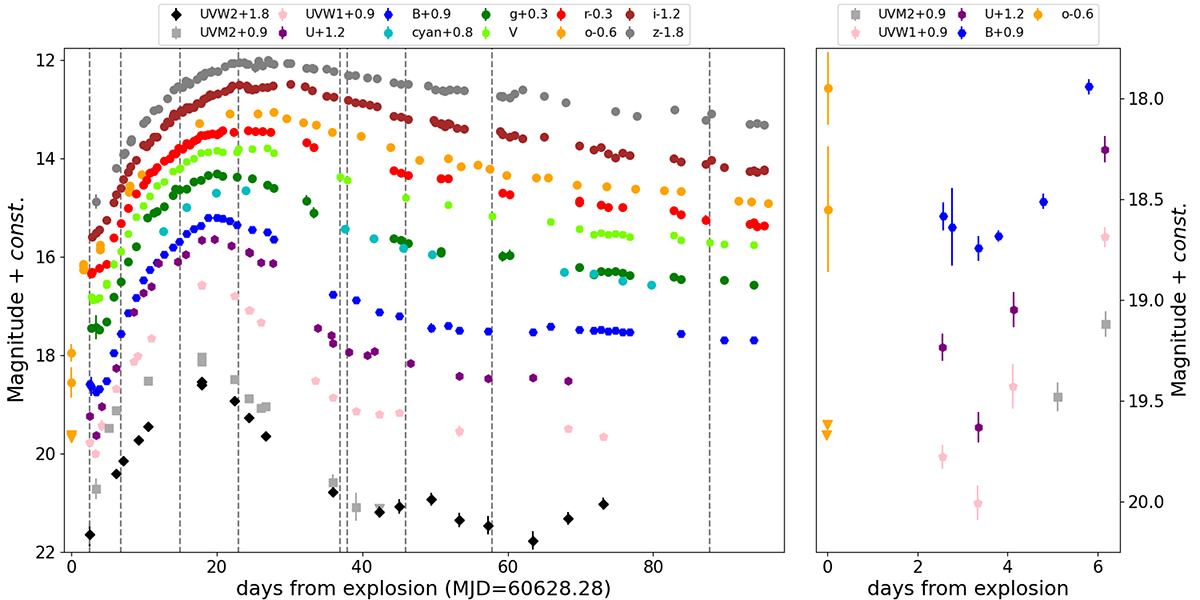
Left: UV and optical light curves of SN 2024abfo in the first 3 months. Dashed grey vertical lines mark the epochs of the spectra. Right: Zoom-in on the early evolution in the ATLAS, UV, and blue filters, highlighting the possible SBO and shock cooling.
Current usage metrics show cumulative count of Article Views (full-text article views including HTML views, PDF and ePub downloads, according to the available data) and Abstracts Views on Vision4Press platform.
Data correspond to usage on the plateform after 2015. The current usage metrics is available 48-96 hours after online publication and is updated daily on week days.
Initial download of the metrics may take a while.