Open Access
Fig. D.2.
Download original image
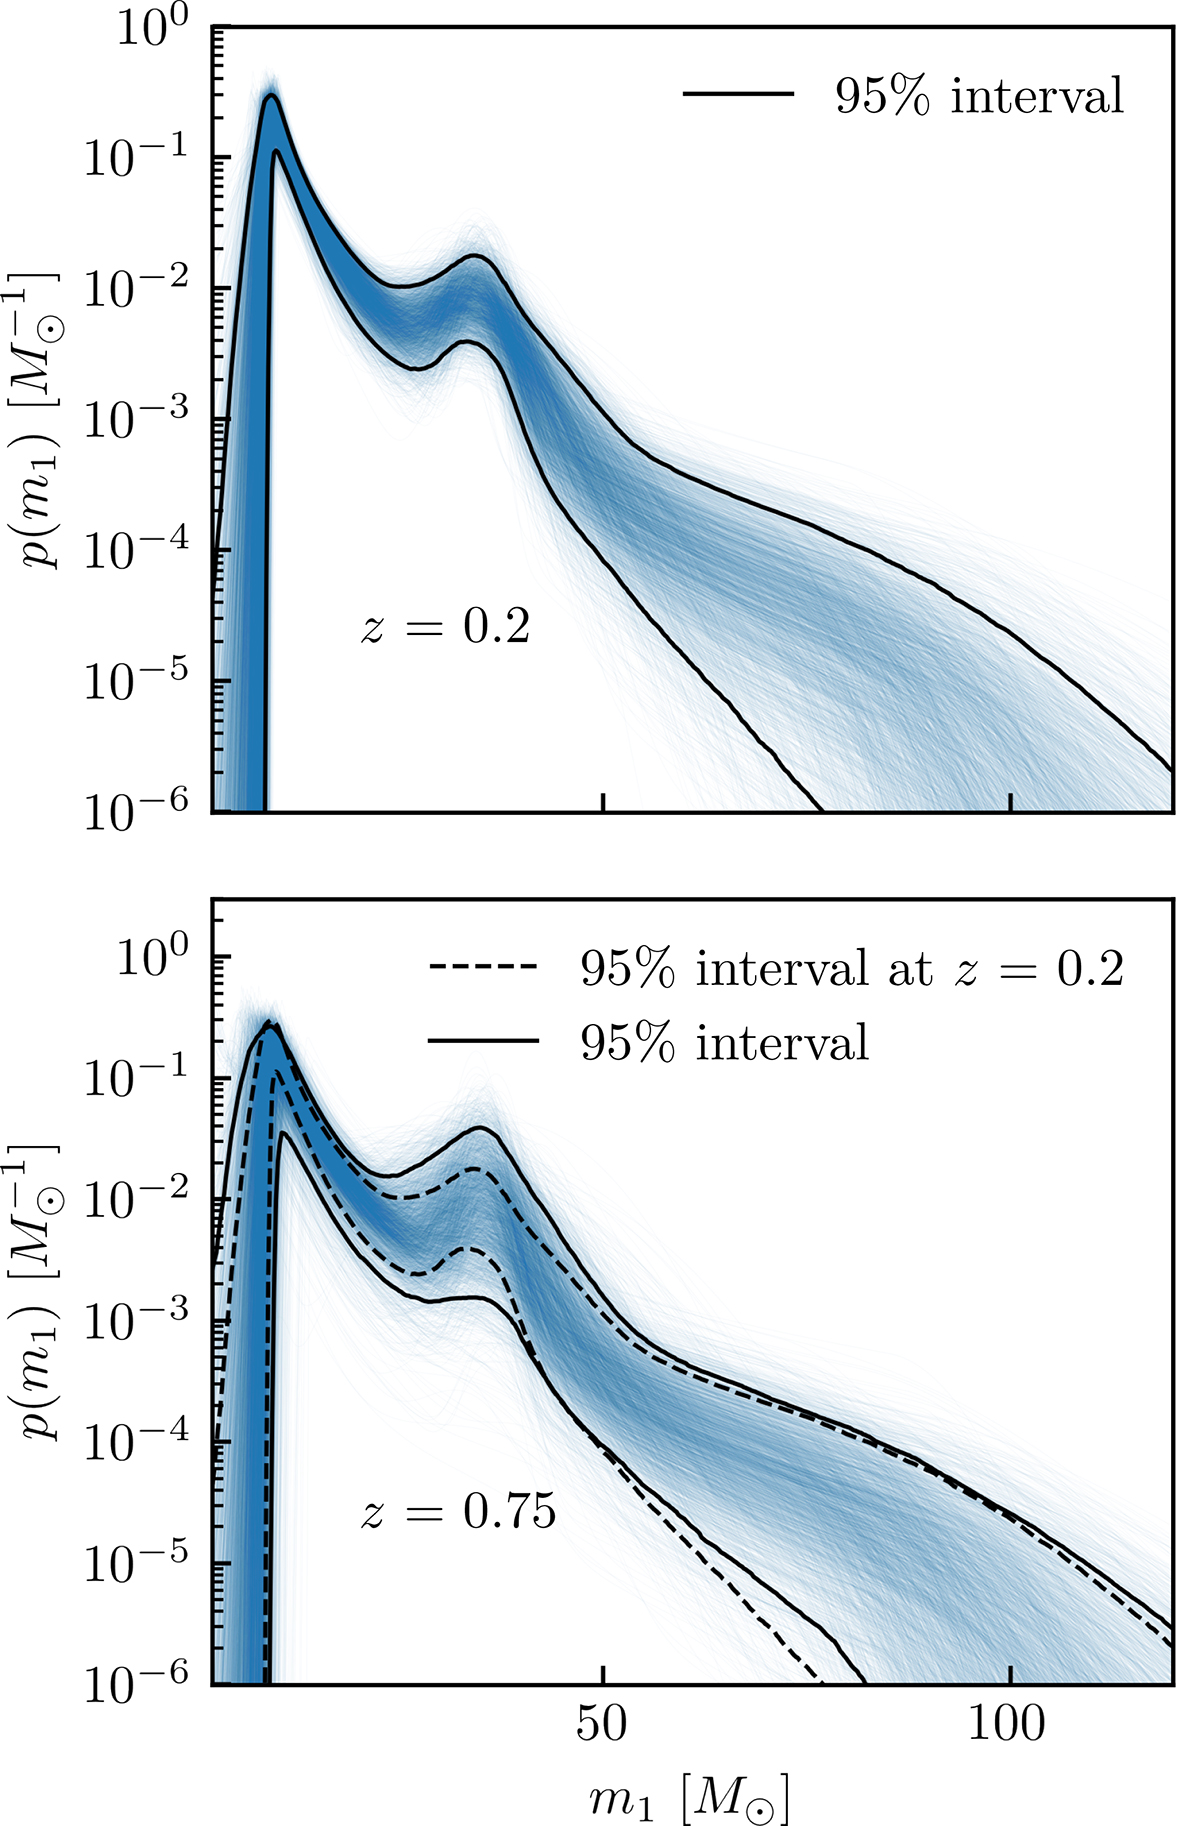
The primary mass distribution is shown for two different redshifts: z = 0.2 and z = 0.75, where the solid black lines show the 95% confidence intervals for the traces at that redshift, while the dashed black lines in the lower panel show the same lines but for z = 0.2 for visual comparison.
Current usage metrics show cumulative count of Article Views (full-text article views including HTML views, PDF and ePub downloads, according to the available data) and Abstracts Views on Vision4Press platform.
Data correspond to usage on the plateform after 2015. The current usage metrics is available 48-96 hours after online publication and is updated daily on week days.
Initial download of the metrics may take a while.