Open Access
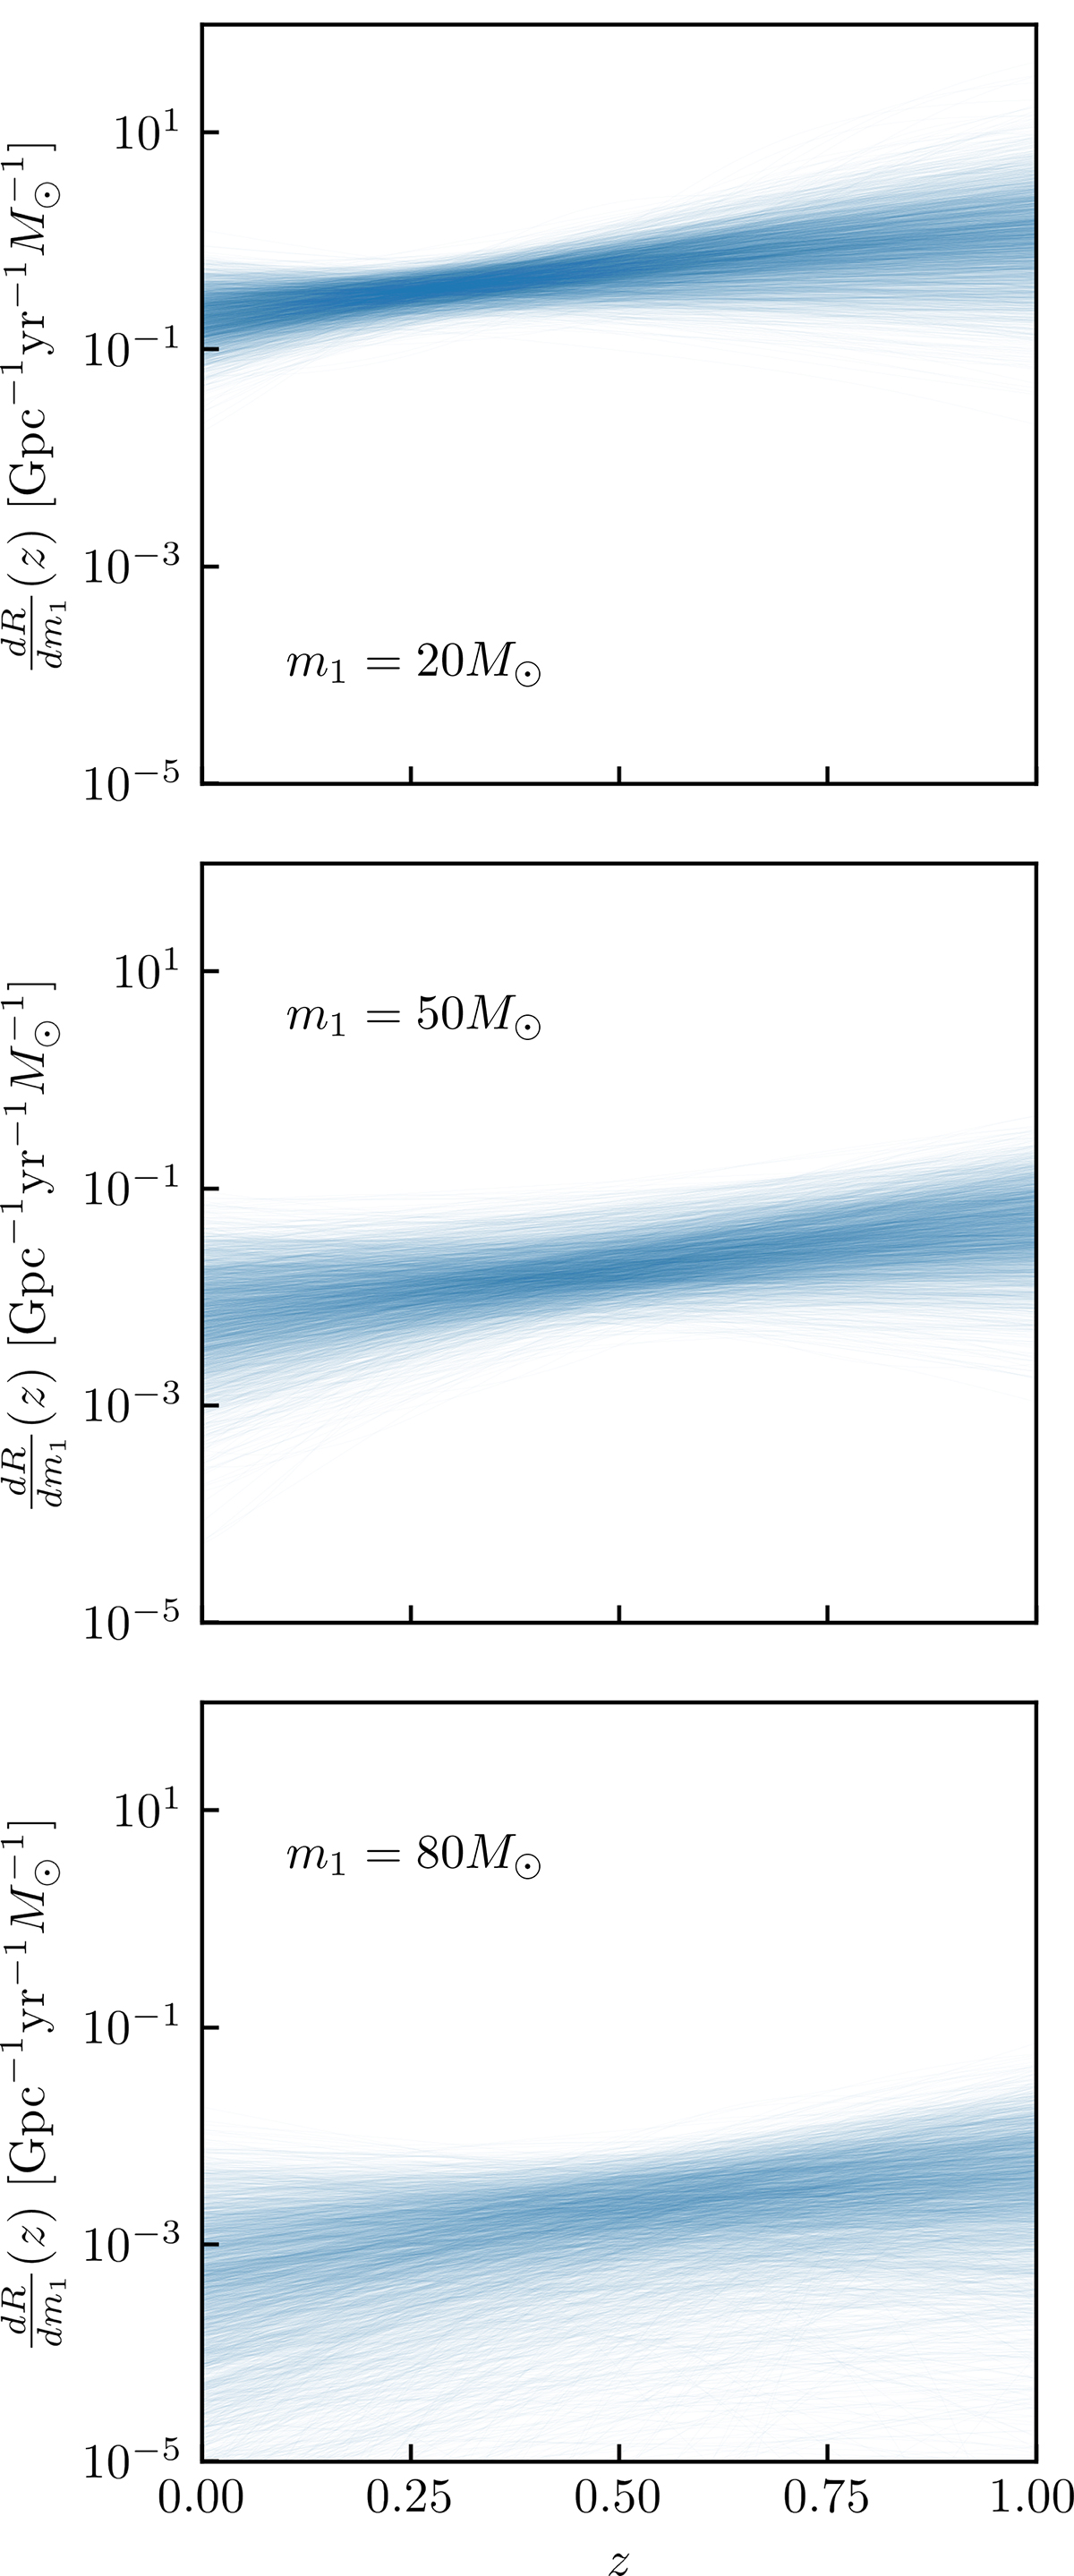
Fig. C.6.
Download original image
Three slices of the differential merger rate consisting out of the power-law analysis samples but viewed at a different m1 are shown. Above, we show m1 = 20 M⊙, in the middle m1 = 50 M⊙ and below m1 = 80 M⊙.
Current usage metrics show cumulative count of Article Views (full-text article views including HTML views, PDF and ePub downloads, according to the available data) and Abstracts Views on Vision4Press platform.
Data correspond to usage on the plateform after 2015. The current usage metrics is available 48-96 hours after online publication and is updated daily on week days.
Initial download of the metrics may take a while.