Fig. 4.
Download original image
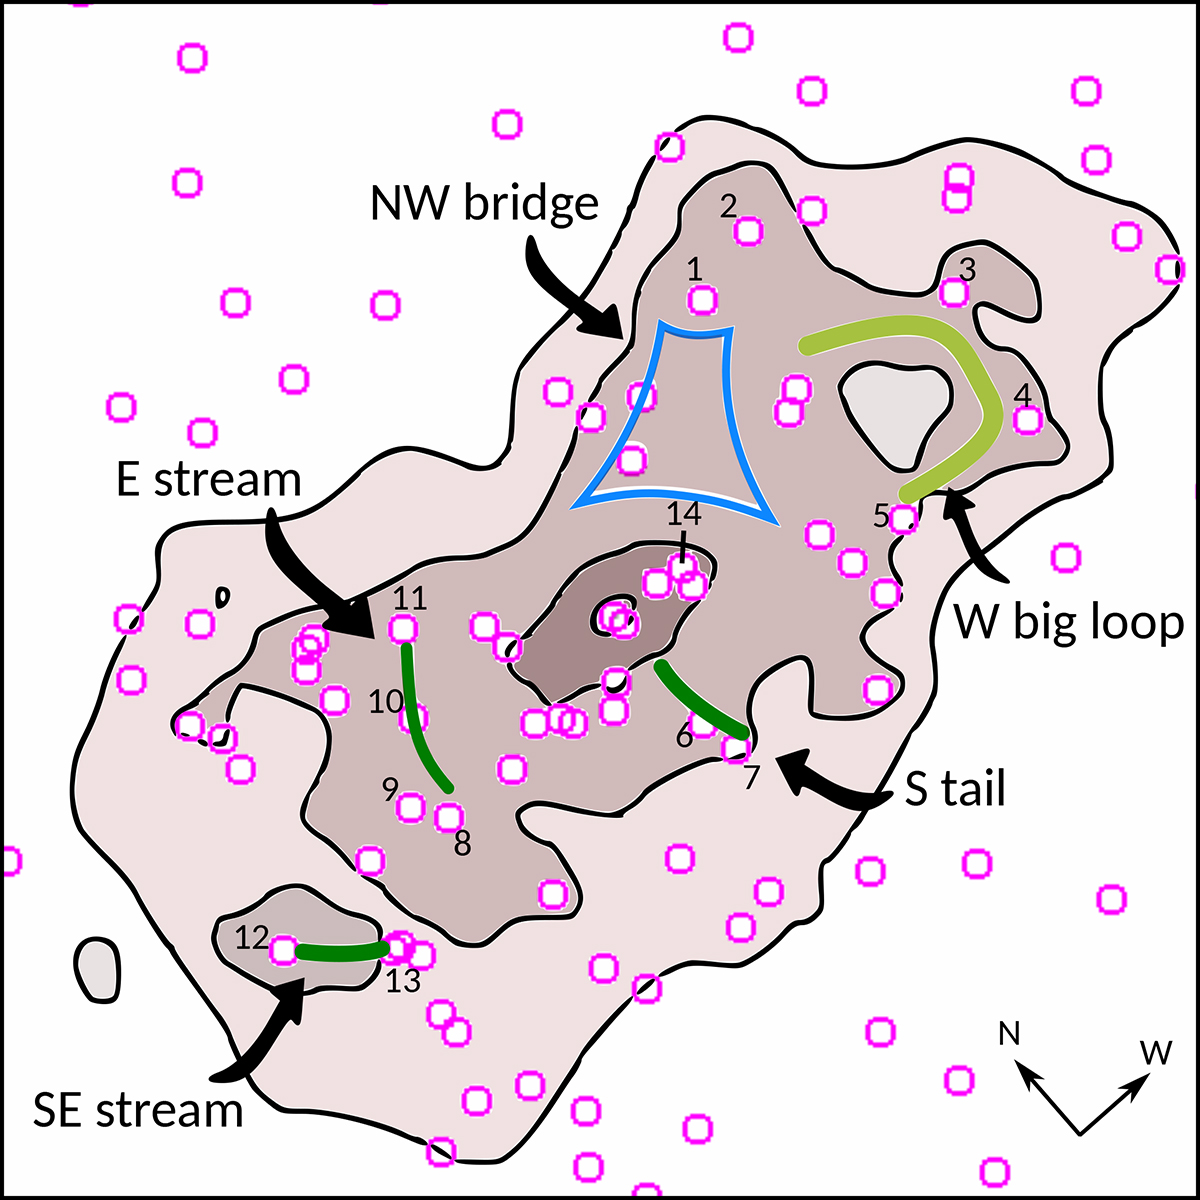
Schematic view of SMACS J0723 stellar content and substructures. The filled contours are drawn from the F356W ICL+BCG map produced by DAWIS. Purple circles indicate satellite galaxies (see Sect. 2.2). Galaxies discussed in the main text are indicated by numbers (1–14, see Sect. 4.2). The main tidal features are highlighted with coloured annotations: the E, SE and S tidal streams are shown in dark green; the external section of the big W loop in light green; and the NW bridge in blue.
Current usage metrics show cumulative count of Article Views (full-text article views including HTML views, PDF and ePub downloads, according to the available data) and Abstracts Views on Vision4Press platform.
Data correspond to usage on the plateform after 2015. The current usage metrics is available 48-96 hours after online publication and is updated daily on week days.
Initial download of the metrics may take a while.